
The Dark Cloud Cover Candle Pattern is one of the most popular bearish reversal candlestick patterns used in technical analysis. It helps traders identify when an uptrend may be losing strength and a potential downward trend could begin.
Whether you are a beginner or an experienced trader, understanding this pattern can help you make better trading decisions and avoid buying near market tops.
In this article, we’ll explain everything about the Dark Cloud Cover Candle Pattern in simple language, including how it forms, why it appears, how to trade it, and the common mistakes traders should avoid.
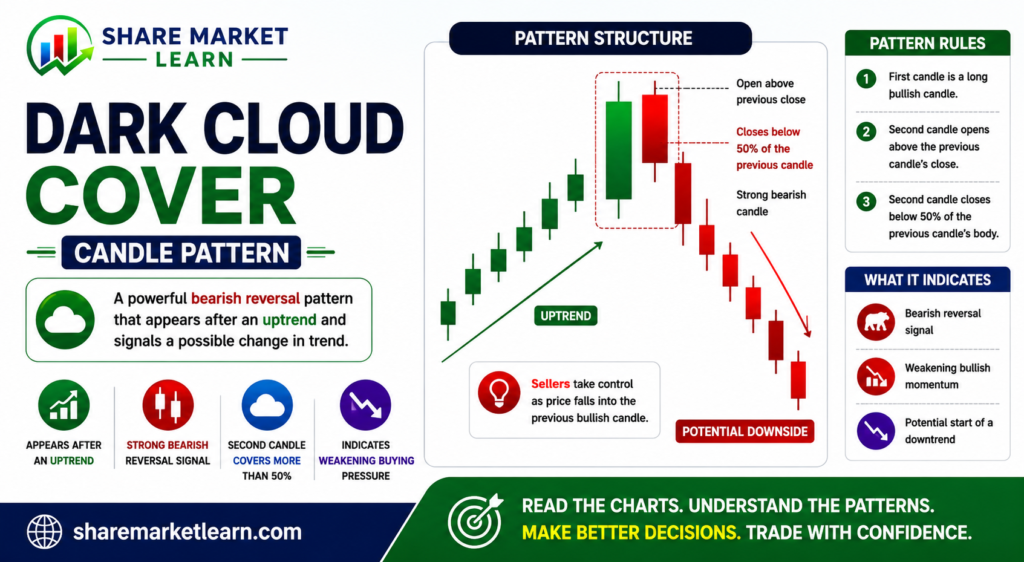
What is the Dark Cloud Cover Candle Pattern?
The Dark Cloud Cover Candle Pattern is a two-candlestick bearish reversal pattern that usually appears after a strong uptrend.
It signals that buyers are losing control and sellers are starting to dominate the market. Although the pattern does not guarantee a price reversal, it serves as an early warning that bullish momentum may be weakening.
Because of this, many traders use the Dark Cloud Cover Pattern to prepare for potential selling opportunities or to protect existing profits.
How is the Dark Cloud Cover Pattern Formed?
The pattern consists of two candles.
First Candle
- A strong bullish (green) candle.
- Shows buyers are in complete control.
- Continues the existing uptrend.
Second Candle
- Opens above the previous candle’s high or close, creating a bullish gap (more common in stocks).
- Selling pressure increases quickly.
- Closes below the midpoint of the first bullish candle.
- Remains above the first candle’s opening price.
This sudden shift from buying pressure to selling pressure creates the bearish reversal signal.
Psychology Behind the Dark Cloud Cover Pattern
Understanding the market psychology makes this pattern much easier to trust.
Here’s what happens behind the scenes:
- Buyers push prices higher during the first candle.
- The next session opens with optimism as buyers continue purchasing.
- Sellers suddenly become aggressive.
- Selling pressure pushes the price deep into the previous bullish candle.
- Buyers begin losing confidence.
- Sellers gain momentum.
This change in market sentiment is what gives the Dark Cloud Cover Pattern its importance.
Key Characteristics of the Dark Cloud Cover Pattern
A valid Dark Cloud Cover Pattern usually has these characteristics:
- Appears after a clear uptrend.
- Consists of two candlesticks.
- The first candle is strongly bullish.
- The second candle opens higher than the previous candle.
- The second candle closes below the midpoint of the first candle.
- Higher trading volume strengthens the signal.
- Confirmation from the next bearish candle increases reliability.
Not every two-candle combination forms a valid Dark Cloud Cover Pattern, so always check these conditions carefully.
How to Identify a Valid Dark Cloud Cover Pattern
Before entering any trade, make sure the following checklist is complete:
✔ A strong uptrend already exists.
✔ The first candle is bullish.
✔ The second candle opens higher.
✔ The second candle closes below 50% of the previous bullish candle.
✔ The market shows increasing selling pressure.
✔ A confirmation candle appears after the pattern.
Following this checklist can help filter out weak or false signals.
What Does the Dark Cloud Cover Pattern Indicate?
The pattern mainly indicates that the market’s bullish momentum is weakening.
It does not guarantee that prices will fall immediately, but it warns traders that:
- Buyers are becoming weaker.
- Sellers are becoming stronger.
- Profit booking may begin.
- A short-term correction could occur.
- A trend reversal is possible.
This is why experienced traders rarely trade the pattern alone. Instead, they combine it with other technical analysis tools for better accuracy.
Best Time to Trade the Dark Cloud Cover Pattern
The pattern works best when it appears:
- Near a major resistance level.
- After a long bullish rally.
- With high trading volume.
- Along with bearish divergence in technical indicators.
- During overbought market conditions.
When several of these factors occur together, the probability of a successful bearish move generally improves.
Indicators That Can Confirm the Pattern
Professional traders often use confirmation indicators before taking a trade.
Some popular indicators include:
1. Relative Strength Index (RSI)
If the RSI is above 70 and a Dark Cloud Cover Pattern appears, the market may be overbought, increasing the chances of a bearish reversal.
2. Moving Averages
If the price struggles to move above a major moving average after forming the pattern, it adds confidence to the bearish signal.
3. MACD
A bearish crossover in the MACD along with the Dark Cloud Cover Pattern provides stronger confirmation that momentum may be shifting in favor of sellers.
4. Volume
Higher trading volume during the second bearish candle shows stronger participation from sellers, making the pattern more reliable.