
Candlestick patterns are one of the most popular tools used by traders to predict future price movements in the stock market. Among the many reversal patterns, the Bearish Harami Candle is widely recognized as a warning sign that an uptrend may soon come to an end.
Whether you’re a beginner or an experienced trader, understanding this pattern can help you make better trading decisions and avoid buying at market tops.
In this article, you’ll learn what the Bearish Harami Candle is, how it forms, why it appears, how to trade it effectively, and the common mistakes to avoid.
What Is a Bearish Harami Candle?
A Bearish Harami Candle is a two-candlestick bearish reversal pattern that appears after a strong uptrend.
The word “Harami” comes from the Japanese language and means “pregnant.” The second candle appears inside the body of the first candle, making it look like a baby inside its mother’s body.
This pattern indicates that buying pressure is weakening and sellers may soon take control.
Although it doesn’t guarantee a reversal, it provides an early warning that the trend may change.
Structure of the Bearish Harami Pattern
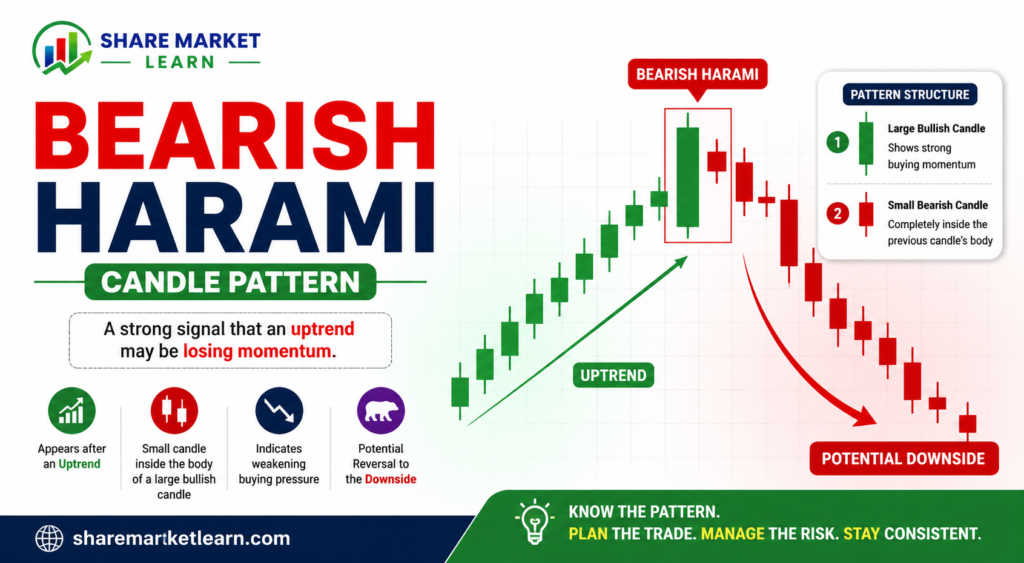
The Bearish Harami consists of two candles:
First Candle
- Large bullish (green) candle
- Shows strong buying momentum
- Continues the existing uptrend
Second Candle
- Small bearish or bullish candle
- Entire body remains inside the previous candle’s body
- Indicates indecision and weakening buying pressure
The smaller second candle is the most important part of the pattern.
Why Does the Bearish Harami Form?
The pattern forms because buyers begin losing strength.
Here’s what happens:
- Buyers push prices higher with a strong bullish candle.
- The next trading session opens near the previous close.
- Buyers fail to continue the rally.
- Sellers slowly enter the market.
- Price closes with a small candle inside the previous candle.
This change in momentum often signals that bulls are becoming exhausted.
What Does the Bearish Harami Indicate?
The Bearish Harami suggests:
- Possible trend reversal
- Weakening bullish momentum
- Increasing seller interest
- Potential short-selling opportunity
- Profit booking by existing buyers
However, traders should always wait for confirmation before entering a trade.
How to Identify a Bearish Harami
Use the following checklist:
✅ Existing uptrend
✅ Large bullish first candle
✅ Small second candle inside the first candle’s body
✅ Lower trading momentum
✅ Confirmation from the next candle
The stronger the previous uptrend, the more reliable the pattern becomes.
Confirmation Is Important
Never trade solely based on the Bearish Harami.
Wait for:
- A strong bearish confirmation candle
- Higher selling volume
- Breakdown below support
- RSI moving downward
- MACD bearish crossover
Confirmation reduces false trading signals.
Trading Strategy Using Bearish Harami
Entry
Enter after the confirmation candle closes below the Bearish Harami.
Stop Loss
Keep the stop loss above the high of the first candle.
Target
Aim for the next major support level.
You can also maintain a minimum Risk-to-Reward Ratio of 1:2.
Example
Imagine a stock rising from ₹400 to ₹470.
A large green candle forms.
The next day, a small red candle forms completely inside the previous green candle.
The third candle closes strongly lower.
This confirms the Bearish Harami.
Many traders may enter a sell trade after confirmation.
Best Indicators to Use
Combining indicators improves accuracy.
RSI
If RSI is above 70 and starts falling, the Bearish Harami becomes stronger.
MACD
A bearish crossover supports the reversal.
Volume
Higher selling volume increases reliability.
Moving Averages
If price falls below the 20 EMA or 50 EMA after the pattern, the bearish signal becomes stronger.
Advantages
- Easy to identify
- Works across all timeframes
- Suitable for stocks, forex, crypto, and commodities
- Provides early reversal signals
- Works well with technical indicators
Limitations
- Can produce false signals
- Needs confirmation
- Less reliable in sideways markets
- Not effective without proper risk management
Common Mistakes
Many beginners make these mistakes:
- Entering before confirmation
- Ignoring market trend
- Trading without stop loss
- Ignoring volume
- Depending only on one candlestick pattern
Avoid these mistakes for better trading performance.
Risk Management Tips
Professional traders always manage risk.
Remember these tips:
- Risk only 1–2% of your capital per trade.
- Use a stop loss on every trade.
- Wait for confirmation before entering.
- Avoid emotional trading.
- Follow your trading plan consistently.
Good risk management is more important than finding the perfect setup.
Key Takeaways
- The Bearish Harami is a two-candle bearish reversal pattern.
- It appears after an uptrend.
- It signals weakening buying pressure.
- Always wait for confirmation.
- Use RSI, MACD, and Volume for better accuracy.
- Follow proper risk management for long-term success.
Frequently Asked Questions (FAQs)
1. Is the Bearish Harami a reliable pattern?
Yes, but it is most reliable when confirmed by the next bearish candle and supported by technical indicators.
2. Can beginners trade the Bearish Harami?
Yes. It is one of the easiest reversal patterns to learn and identify.
3. Which timeframe works best?
The pattern works on all timeframes, but daily and 4-hour charts generally provide stronger signals.
4. Should I use indicators with the Bearish Harami?
Yes. RSI, MACD, Volume, and Moving Averages help improve trading accuracy.
5. Is the Bearish Harami suitable for intraday trading?
Yes, provided it appears in a strong trend and is confirmed by price action.
Conclusion
The Bearish Harami Candle is a valuable candlestick pattern that can help traders identify potential market reversals before prices decline. While it offers an early warning of weakening bullish momentum, it should never be used in isolation. Always combine it with confirmation candles, technical indicators, and proper risk management.
With regular practice and disciplined trading, the Bearish Harami can become an effective part of your trading strategy and help you make more informed decisions in the stock market.