
Introduction
The stock market is full of opportunities, but identifying the right entry point can be challenging. This is where candlestick patterns become valuable tools for traders and investors. One such popular reversal pattern is the Bullish Harami.
The Bullish Harami pattern helps traders identify a potential trend reversal from a bearish market to a bullish market. Whether you are a beginner or an experienced trader, understanding this pattern can improve your trading decisions and increase your confidence in market analysis.
In this article, we will explore what a Bullish Harami is, how it forms, how to identify it on a chart, its advantages and limitations, and how traders can use it effectively.
What Is a Bullish Harami?
A Bullish Harami is a two-candlestick reversal pattern that typically appears at the end of a downtrend. It indicates that selling pressure may be weakening and buyers could be preparing to take control of the market.
The word “Harami” comes from a Japanese term meaning “pregnant.” The pattern gets its name because the second candle is completely contained within the body of the first candle, resembling a pregnant figure.
The Bullish Harami is considered a bullish reversal signal and is commonly used in technical analysis.
Structure of a Bullish Harami Pattern
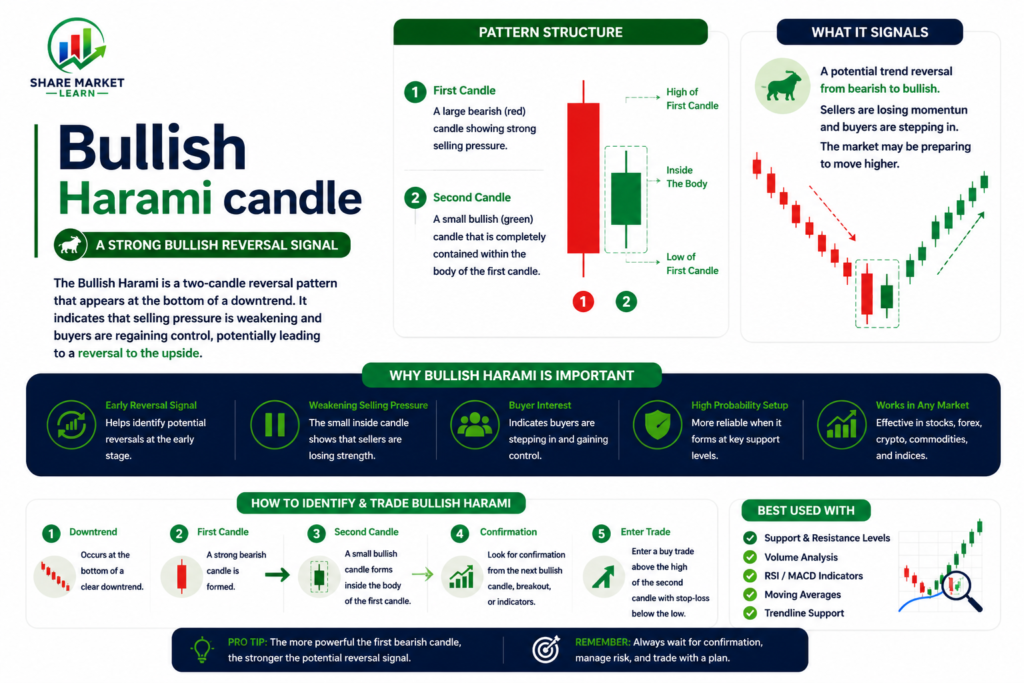
The Bullish Harami consists of two candles:
First Candle
- A large bearish (red or black) candle
- Shows strong selling pressure
- Continues the existing downtrend
Second Candle
- A smaller bullish (green or white) candle
- Opens and closes within the body of the first candle
- Indicates weakening bearish momentum
This combination suggests that sellers are losing strength and buyers may be entering the market.
How Does a Bullish Harami Work?
The psychology behind the Bullish Harami pattern is simple.
During the first candle, sellers dominate the market and push prices lower. This reinforces the existing bearish trend.
On the next trading session, however, the market does not continue falling aggressively. Instead, the price movement becomes smaller and closes positively within the previous candle’s range.
This change in momentum indicates uncertainty among sellers and growing confidence among buyers. If buying pressure continues after the pattern forms, a bullish reversal may occur.
How to Identify a Bullish Harami
When looking for a Bullish Harami on a chart, follow these steps:
1. Find a Downtrend
The pattern is most effective when it appears after a clear downward price movement.
2. Look for a Large Bearish Candle
The first candle should show strong selling activity.
3. Find a Small Bullish Candle
The second candle should be smaller and remain within the body of the first candle.
4. Wait for Confirmation
Many traders wait for the next candle to close above the Bullish Harami before entering a trade.
Confirmation helps reduce false signals.
Example of a Bullish Harami
Imagine a stock has been falling for several days.
- Day 1: The stock closes with a large bearish candle.
- Day 2: A small bullish candle forms inside the body of Day 1’s candle.
- Day 3: The stock moves higher and closes above the high of Day 2.
This sequence confirms the Bullish Harami and suggests a possible upward trend.
Bullish Harami vs Bullish Engulfing Pattern
Many beginners confuse the Bullish Harami with the Bullish Engulfing pattern.
Bullish Harami
- Small bullish candle inside a larger bearish candle
- Indicates a possible reversal
- Generally considered a moderate bullish signal
Bullish Engulfing
- Large bullish candle completely engulfs the previous bearish candle
- Stronger indication of buying pressure
- Often viewed as a stronger reversal signal
Both patterns can be useful, but traders usually consider the Bullish Engulfing pattern more powerful.
Benefits of Using the Bullish Harami Pattern
Easy to Identify
The two-candle structure makes it simple for beginners to recognize.
Early Reversal Signal
It can provide an early indication that a downtrend may be ending.
Works Across Markets
The Bullish Harami can be used in:
- Stocks
- Forex
- Commodities
- Cryptocurrency
- Indices
Suitable for Multiple Time Frames
Traders can use it on:
- Intraday charts
- Swing trading charts
- Daily charts
- Weekly charts
Limitations of the Bullish Harami Pattern
While the Bullish Harami can be helpful, it is not perfect.
False Signals
Not every Bullish Harami results in a trend reversal.
Requires Confirmation
Entering a trade without confirmation can increase risk.
Market Conditions Matter
The pattern tends to perform better when combined with other technical indicators.
Best Indicators to Use with Bullish Harami
To improve accuracy, traders often combine the Bullish Harami with other tools.
Support Levels
A Bullish Harami forming near a strong support zone can provide a stronger signal.
Relative Strength Index (RSI)
An RSI reading below 30 may indicate an oversold condition, supporting the possibility of a reversal.
Moving Averages
A bullish crossover after the pattern forms can strengthen the signal.
Volume Analysis
Higher trading volume during confirmation can indicate stronger buyer participation.
Trading Strategy Using Bullish Harami
Entry Point
Enter the trade after confirmation, usually when the next candle closes above the Bullish Harami.
Stop Loss
Place the stop loss below the low of the pattern.
Target
Use nearby resistance levels or maintain a favorable risk-reward ratio such as 1:2 or 1:3.
Risk Management
Never risk more than a small percentage of your trading capital on a single trade.
Common Mistakes Traders Make
Ignoring the Trend
The Bullish Harami is a reversal pattern and should ideally appear after a downtrend.
Trading Without Confirmation
Waiting for confirmation can help avoid false entries.
Ignoring Volume
Volume can provide valuable clues about market participation.
Overlooking Support Zones
Patterns near important support levels are generally more reliable.
Tips for Beginners
- Always analyze the broader market trend.
- Use confirmation before entering a trade.
- Combine the pattern with RSI and support levels.
- Practice on historical charts.
- Follow proper risk management rules.
- Avoid making decisions based on a single indicator.
Conclusion
The Bullish Harami candlestick pattern is a useful technical analysis tool that helps traders identify potential bullish reversals after a downtrend. Its simple two-candle structure makes it easy to understand and apply, even for beginners.
However, like all trading patterns, it should not be used in isolation. Combining the Bullish Harami with support levels, RSI, volume analysis, and proper risk management can significantly improve trading decisions.
By understanding the psychology behind the pattern and waiting for confirmation before entering a trade, traders can increase their chances of identifying profitable opportunities in the market.