
Introduction
The Bollinger Bands Indicator is one of the most popular technical analysis tools used by traders and investors around the world. It helps traders understand market volatility, identify possible overbought and oversold conditions, and spot potential trading opportunities.
Whether you trade stocks, forex, cryptocurrencies, commodities, or indices, Bollinger Bands can provide valuable insights into price movements. However, like every technical indicator, it should not be used alone. Combining it with price action, support and resistance, and other indicators can improve trading decisions.
In this beginner-friendly guide, you’ll learn what Bollinger Bands are, how they work, how to use them effectively, their advantages and limitations, common trading strategies, and answers to frequently asked questions.
What Is the Bollinger Bands Indicator?
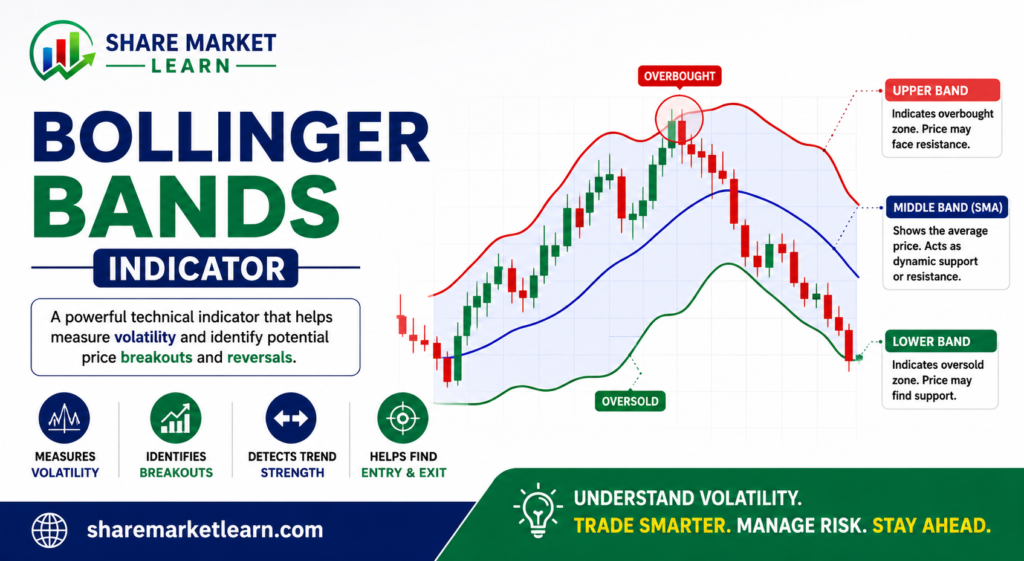
The Bollinger Bands Indicator is a volatility indicator developed by John Bollinger in the early 1980s. It consists of three lines plotted on a price chart:
- Middle Band: A 20-period Simple Moving Average (SMA).
- Upper Band: The SMA plus two standard deviations.
- Lower Band: The SMA minus two standard deviations.
These three bands expand and contract depending on market volatility.
When volatility increases, the bands widen. When volatility decreases, the bands become narrower.
Components of Bollinger Bands
1. Middle Band
The middle band is typically a 20-period Simple Moving Average (SMA).
It represents the average price over the last 20 periods and acts as the center line of the indicator.
2. Upper Band
The upper band is calculated by adding two standard deviations to the moving average.
When the price approaches the upper band, it may indicate strong buying momentum or an overbought market.
3. Lower Band
The lower band is calculated by subtracting two standard deviations from the moving average.
When the price approaches the lower band, it may indicate strong selling pressure or an oversold market.
How Bollinger Bands Work
Bollinger Bands measure market volatility rather than predicting price direction.
Here is how traders interpret them:
- Wide Bands: High market volatility.
- Narrow Bands: Low market volatility.
- Price Touching Upper Band: Strong bullish momentum or possible overbought conditions.
- Price Touching Lower Band: Strong bearish momentum or possible oversold conditions.
It’s important to remember that touching a band does not automatically mean the price will reverse. Strong trends can cause prices to “ride the band” for extended periods.
Bollinger Bands Formula
The indicator uses the following calculations:
- Middle Band = 20-period Simple Moving Average (SMA)
- Upper Band = SMA + (2 × Standard Deviation)
- Lower Band = SMA − (2 × Standard Deviation)
Most trading platforms calculate these values automatically, so traders rarely need to perform the calculations manually.
Best Bollinger Bands Settings
The default settings are:
- Period: 20
- Standard Deviation: 2
These settings work well for many markets and timeframes. However, experienced traders may adjust them depending on their strategy and the asset being traded.
How to Trade Using Bollinger Bands
Strategy 1: Bollinger Band Bounce
This strategy assumes that prices often move back toward the middle band after reaching the upper or lower band.
- Price touches the upper band → Watch for possible selling opportunities.
- Price touches the lower band → Watch for possible buying opportunities.
Always look for confirmation from candlestick patterns or other indicators before entering a trade.
Strategy 2: Bollinger Band Breakout
When the bands become very narrow, the market is experiencing low volatility. This is known as a Bollinger Band Squeeze.
A squeeze often precedes a strong price movement.
- Breakout above the upper band may indicate bullish momentum.
- Breakout below the lower band may indicate bearish momentum.
Confirmation is essential before entering a trade.
Strategy 3: Trend Following
In strong trends, prices can stay close to the upper or lower band for a long time.
- During an uptrend, prices may repeatedly touch the upper band.
- During a downtrend, prices may frequently touch the lower band.
This behavior can confirm trend strength rather than signal an immediate reversal.
Best Indicators to Combine with Bollinger Bands
Bollinger Bands become more effective when used alongside other technical tools.
Relative Strength Index (RSI)
RSI helps identify overbought and oversold conditions, providing additional confirmation.
Moving Average Convergence Divergence (MACD)
MACD confirms trend direction and momentum.
Volume
Higher trading volume during a breakout increases the reliability of the signal.
Support and Resistance
Combining Bollinger Bands with support and resistance levels improves trade selection.
Candlestick Patterns
Patterns like Doji, Hammer, Engulfing, and Inside Bar can strengthen entry and exit decisions.
Advantages of Bollinger Bands
Some key benefits include:
- Easy to understand and use.
- Suitable for beginners and experienced traders.
- Works across multiple markets.
- Measures market volatility effectively.
- Helps identify breakout opportunities.
- Can be used on different timeframes.
Limitations of Bollinger Bands
Despite their popularity, Bollinger Bands have limitations.
- They do not predict future price direction.
- Strong trends can keep prices near one band for a long time.
- False breakouts can occur.
- They should not be used alone.
- Confirmation from other tools is important.
Common Mistakes Beginners Make
Avoid these common mistakes:
Assuming Every Band Touch Is a Reversal
A price touching the upper or lower band does not always mean it will reverse immediately.
Ignoring the Overall Trend
Always consider the broader market trend before taking a trade.
Trading Without Confirmation
Wait for supporting signals such as candlestick patterns, RSI, or volume.
Not Using Stop-Loss Orders
Risk management is essential in every trading strategy.
Example of Bollinger Bands in Action
Imagine a stock has been trading in a narrow range for several days. The Bollinger Bands become very close together, forming a squeeze.
The stock then breaks above the upper band with strong trading volume.
This breakout suggests increasing bullish momentum. A trader may wait for confirmation before entering a buy trade while placing a stop-loss below a recent support level.
This example shows how Bollinger Bands can help identify potential trading opportunities when combined with sound risk management.
Tips for Beginners
- Start with the default settings (20, 2).
- Use Bollinger Bands together with RSI or MACD.
- Wait for confirmation before entering trades.
- Avoid trading solely because the price touches a band.
- Practice on historical charts or a demo account.
- Maintain a disciplined risk management plan.
Consistency, patience, and continuous learning are the keys to becoming a successful trader.
Conclusion
The Bollinger Bands Indicator is a powerful and versatile tool that helps traders measure market volatility and identify potential trading opportunities. By understanding how the bands expand, contract, and interact with price, traders can make more informed decisions.
However, Bollinger Bands are most effective when combined with other forms of technical analysis, such as support and resistance, candlestick patterns, RSI, MACD, and volume analysis. No indicator is perfect, but using Bollinger Bands within a well-planned trading strategy can improve consistency and confidence.
For beginners, mastering Bollinger Bands is an excellent step toward building a solid foundation in technical analysis.
Frequently Asked Questions (FAQs)
1. What are Bollinger Bands?
Bollinger Bands are a technical analysis indicator consisting of a middle moving average and two outer bands that measure market volatility.
2. Who created the Bollinger Bands Indicator?
The indicator was developed by John Bollinger in the early 1980s.
3. What are the default Bollinger Bands settings?
The standard settings are a 20-period Simple Moving Average with 2 standard deviations for the upper and lower bands.
4. Can Bollinger Bands predict market direction?
No. They measure volatility and highlight potential opportunities but do not predict future price direction on their own.
5. Which indicators work best with Bollinger Bands?
Many traders combine Bollinger Bands with RSI, MACD, volume analysis, support and resistance, and candlestick patterns for stronger confirmation.
6. Are Bollinger Bands suitable for beginners?
Yes. They are one of the easiest technical indicators to learn and can be used across different financial markets and timeframes.