
Introduction
Candlestick patterns are one of the most effective tools used in technical analysis to understand market sentiment and predict possible price movements. Among the many reversal patterns, the Tweezer Top Candle is considered a reliable signal that may indicate the end of an uptrend and the beginning of a bearish move.
If you are new to trading or investing, learning how to identify and trade the Tweezer Top pattern can help you make more informed decisions. While no candlestick pattern guarantees success, combining the Tweezer Top with other technical tools can improve the probability of finding quality trading opportunities.
In this guide, you’ll learn what the Tweezer Top Candle is, how it forms, why it works, how to trade it, common mistakes to avoid, and answers to frequently asked questions.
What Is a Tweezer Top Candle?
A Tweezer Top is a bearish reversal candlestick pattern that usually appears after a strong uptrend. It consists of two consecutive candles with nearly the same high price.
- The first candle is bullish, showing that buyers are in control.
- The second candle is bearish, indicating that sellers have entered the market and rejected higher prices.
The matching highs suggest that buyers tried to push prices higher again but failed. This rejection often signals that bullish momentum is weakening and a downward reversal may follow.
Why Is It Called a Tweezer Top?
The word “tweezer” comes from the resemblance of the two candle highs. Just like the two tips of a pair of tweezers line up evenly, both candles in this pattern reach nearly the same high level.
This equal high acts as a resistance area where sellers repeatedly prevent the price from moving higher.
How Does the Tweezer Top Pattern Form?
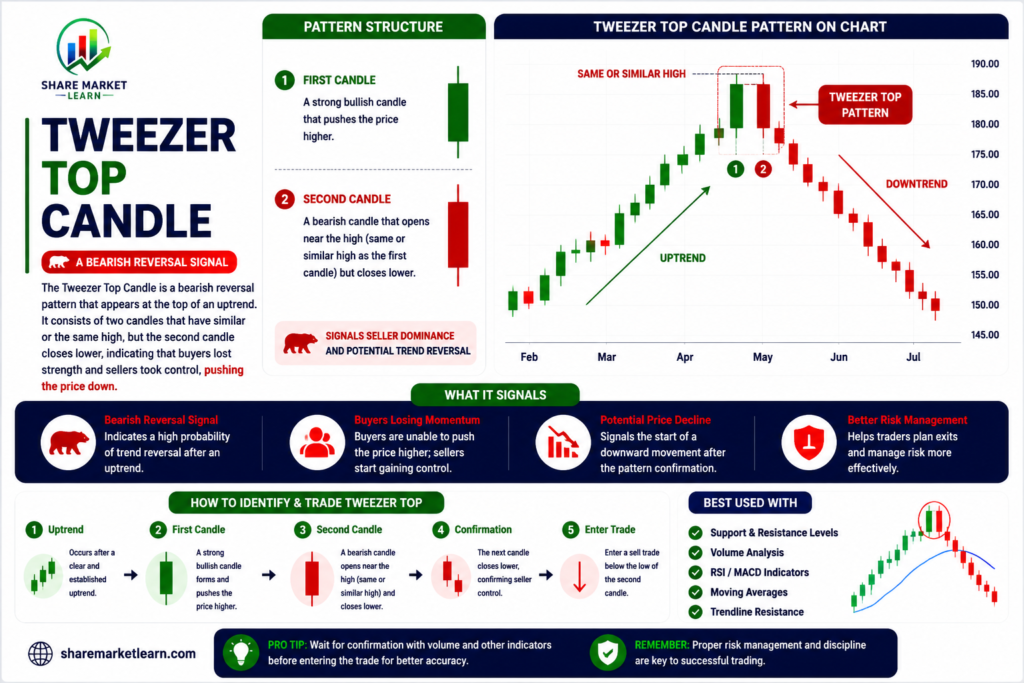
The pattern develops in four simple steps.
1. Existing Uptrend
The market has been moving upward, showing strong buying momentum.
2. First Bullish Candle
A bullish candle closes near its high, confirming that buyers are still in control.
3. Second Candle Tests the Same High
The next candle reaches almost the same high as the previous candle but struggles to move above it.
4. Sellers Take Control
Instead of continuing upward, sellers push the price lower, and the second candle closes bearish.
This shift in control often warns traders that the uptrend could be ending.
Market Psychology Behind the Tweezer Top
Understanding the psychology behind the pattern makes it easier to trust the signal.
Buyers Are Confident
During the uptrend, buyers continue purchasing because they expect prices to rise further.
Resistance Appears
When the market reaches the same high for a second time, buyers fail to break above that level.
Sellers Gain Strength
Seeing the rejection, sellers enter aggressively, causing the second candle to close lower.
Momentum Changes
The balance shifts from buyers to sellers, increasing the possibility of a bearish reversal.
How to Identify a Valid Tweezer Top
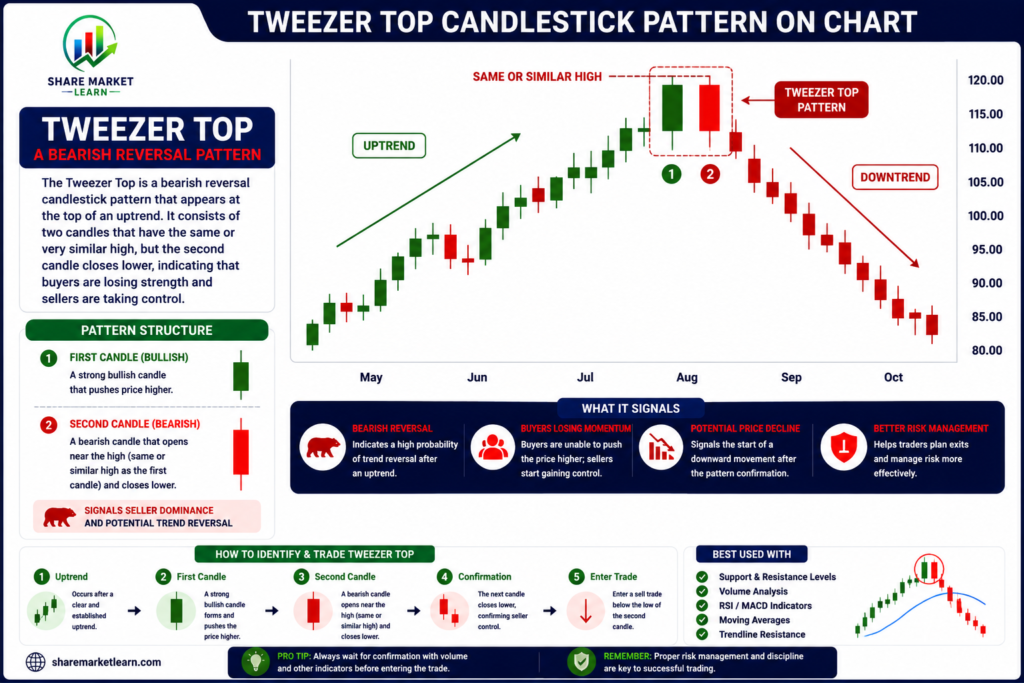
Look for these characteristics:
- It appears after a noticeable uptrend.
- Two consecutive candles have nearly identical highs.
- The first candle is bullish.
- The second candle is bearish.
- Higher trading volume adds confidence to the signal.
- Confirmation comes from the next candle closing lower.
The more conditions that are met, the stronger the pattern becomes.
How to Trade the Tweezer Top Pattern
Many experienced traders avoid entering immediately after spotting the pattern. Instead, they wait for confirmation.
Step 1: Identify the Pattern
Confirm that both candles share nearly the same high and appear after an uptrend.
Step 2: Wait for Confirmation
Allow the next candle to close below the second candle’s low. This confirms that sellers are gaining control.
Step 3: Enter the Trade
Many traders consider entering a sell trade after confirmation.
Step 4: Place a Stop-Loss
A common approach is to place the stop-loss slightly above the highest point of the Tweezer Top.
Step 5: Set a Profit Target
Profit targets can be based on:
- Previous support levels
- Risk-to-reward ratio (such as 1:2)
- Technical indicators
- Trendline support
Best Indicators to Use with a Tweezer Top
The pattern becomes more reliable when combined with other technical analysis tools.
Support and Resistance
A Tweezer Top forming near a strong resistance level often carries greater significance.
Volume
Higher selling volume during the second candle strengthens the bearish signal.
Relative Strength Index (RSI)
If the RSI indicates overbought conditions, the reversal signal becomes more convincing.
Moving Averages
A break below a key moving average after the pattern may provide additional confirmation.
MACD
A bearish crossover on the MACD can further support the reversal.
Advantages of the Tweezer Top Pattern
Some benefits include:
- Easy for beginners to identify.
- Works in stocks, forex, commodities, indices, and cryptocurrencies.
- Can be used on multiple timeframes.
- Helps identify potential trend reversals.
- Improves trade timing when combined with other indicators.
Limitations of the Tweezer Top
Like every trading pattern, it has limitations.
- It can produce false signals.
- Confirmation is important before entering a trade.
- It is less reliable in sideways markets.
- Risk management remains essential.
- It should never be used as the only reason to take a trade.
Common Mistakes Beginners Make
Avoid these common errors:
Trading Too Early
Entering before confirmation increases the risk of false breakouts.
Ignoring Market Trend
The pattern works best after a clear uptrend.
Skipping Stop-Loss Orders
Always protect your trading capital.
Depending Only on One Pattern
Combine candlestick patterns with other technical tools for better results.
Example of a Tweezer Top
Imagine a stock has been rising steadily for several days.
On Day 1, the stock reaches ₹500 and closes strongly with a bullish candle.
On Day 2, the price again touches ₹500 but fails to move higher. Selling pressure increases, and the stock closes lower, creating a bearish candle.
The following day, the price falls below the low of the second candle.
This sequence forms a classic Tweezer Top pattern and confirms a possible bearish reversal.
Tips for Beginners
- Practice identifying patterns on historical charts.
- Always wait for confirmation.
- Combine the pattern with support and resistance.
- Manage risk using stop-loss orders.
- Avoid emotional trading.
- Keep a trading journal to track your performance.
Consistency and discipline are more important than trying to win every trade.
Conclusion
The Tweezer Top Candle is one of the most useful bearish reversal patterns in technical analysis. It highlights a point where buyers fail to push prices above an important resistance level, allowing sellers to take control.
Although it is a valuable signal, no candlestick pattern guarantees success. The best approach is to use the Tweezer Top alongside confirmation candles, support and resistance levels, volume analysis, and proper risk management.
By practicing on historical charts and following a disciplined trading plan, beginners can gradually learn to use this pattern with greater confidence.
Frequently Asked Questions (FAQs)
1. Is the Tweezer Top a bearish pattern?
Yes. It is generally considered a bearish reversal pattern that appears after an uptrend.
2. Is the Tweezer Top reliable?
It can be reliable when it forms after a strong uptrend and is confirmed by the next candle, higher volume, or other technical indicators.
3. Can beginners use the Tweezer Top pattern?
Yes. It is one of the easier candlestick patterns to identify and is suitable for beginners.
4. Which timeframe is best for the Tweezer Top?
The pattern can appear on any timeframe, but many traders consider signals on higher timeframes (such as daily or weekly charts) to be more reliable than very short-term charts.
5. Should I trade every Tweezer Top pattern?
No. Wait for confirmation and use other technical analysis tools before entering a trade.
6. Can the Tweezer Top be used in all markets?
Yes. It can be applied to stocks, forex, commodities, indices, and cryptocurrencies because it reflects market psychology rather than a specific asset class.