
The Hanging Man candle is one of the most popular candlestick patterns used in technical analysis. Traders across the world use this pattern to identify a possible trend reversal in the stock market. Although it may look simple, understanding how the Hanging Man candle works can help traders make better trading decisions and manage risk more effectively.
In this article, we will explore what the Hanging Man candle is, how it forms, what it indicates, and how traders can use it in their trading strategies.
What Is a Hanging Man Candle?
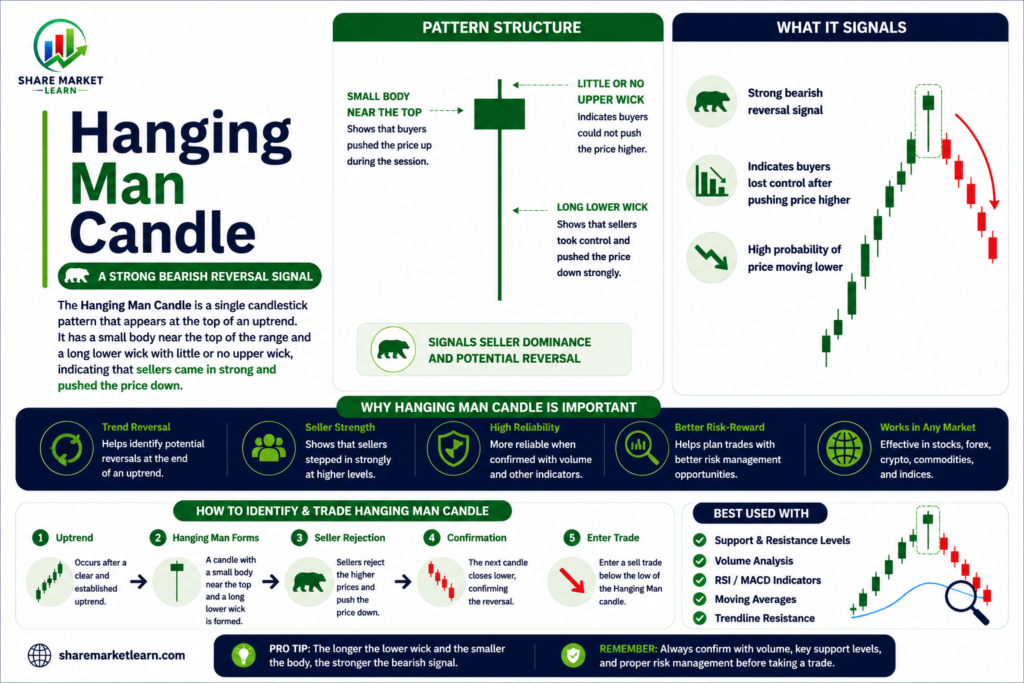
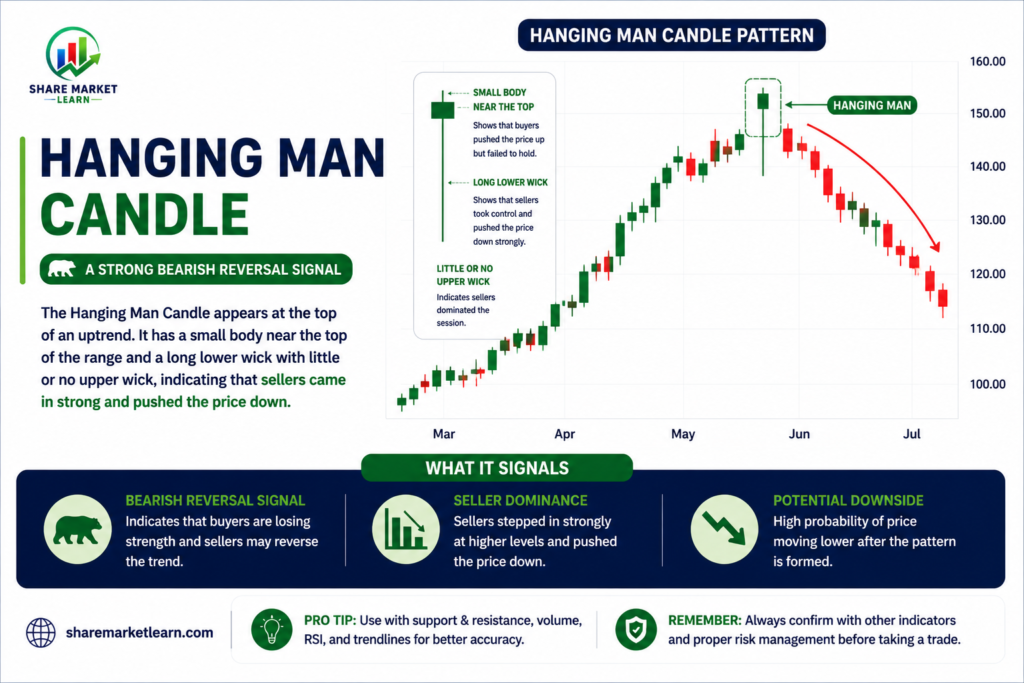
The Hanging Man candle is a bearish reversal candlestick pattern that appears after an upward price trend. It suggests that the buying pressure may be weakening and that sellers could soon take control of the market.
The pattern gets its name from its appearance. It has a small real body near the top of the candle and a long lower shadow, making it resemble a person hanging upside down.
However, traders should remember that the Hanging Man candle does not guarantee a market reversal. Instead, it serves as a warning signal that requires confirmation before taking any trading action.
Characteristics of the Hanging Man Candle
To identify a Hanging Man candle correctly, look for the following features:
1. Appears After an Uptrend
The pattern is meaningful only when it forms after a noticeable upward trend. Without an existing uptrend, the signal loses its importance.
2. Small Real Body
The candle has a relatively small body located near the upper end of the trading range.
The body can be bullish or bearish:
- A green candle indicates the closing price is above the opening price.
- A red candle indicates the closing price is below the opening price.
Many traders consider a red Hanging Man slightly more bearish.
3. Long Lower Shadow
The lower wick should be at least twice the size of the real body.
This long shadow shows that sellers pushed prices significantly lower during the session.
4. Little or No Upper Shadow
The upper shadow is either very small or completely absent.
This characteristic gives the pattern its distinctive appearance.
How Does the Hanging Man Candle Form?
Understanding the psychology behind the pattern is essential.
During an uptrend, buyers are generally in control. When a Hanging Man candle forms:
- The market opens near the previous closing price.
- Sellers suddenly enter the market and push prices sharply lower.
- Buyers manage to recover much of the decline before the session closes.
- The candle closes near its opening price.
Although buyers regain control by the close, the strong selling pressure during the session raises concerns about the strength of the ongoing uptrend.
It suggests that sellers are becoming active and that a reversal may be approaching.
Market Psychology Behind the Hanging Man Candle
Candlestick patterns reflect the emotions and decisions of market participants.
The Hanging Man candle represents uncertainty and a shift in sentiment.
Before the pattern forms:
- Buyers dominate the market.
- Optimism remains high.
- Prices continue moving upward.
During the formation:
- Sellers test the strength of buyers.
- Prices decline sharply.
- Buyers recover the losses.
After the formation:
- Traders become cautious.
- Confidence in the uptrend begins to weaken.
- Market participants look for confirmation of a potential reversal.
Understanding this psychology helps traders avoid relying solely on the candle’s appearance.
Confirmation of the Hanging Man Pattern
One of the biggest mistakes beginners make is trading immediately after spotting a Hanging Man candle.
Confirmation is essential.
Traders typically look for the following:
Bearish Confirmation Candle
The next candle should close below the Hanging Man candle’s closing price.
A strong bearish candle strengthens the reversal signal.
Increased Trading Volume
Higher trading volume during the Hanging Man formation suggests stronger participation from sellers.
This increases the reliability of the pattern.
Technical Indicators
Combining the Hanging Man with other indicators can improve accuracy.
Common indicators include:
- Relative Strength Index (RSI)
- Moving Averages
- MACD
- Support and Resistance levels
Using multiple tools reduces the chances of false signals.
How to Trade the Hanging Man Candle
The Hanging Man pattern can be incorporated into a structured trading plan.
Step 1: Identify an Uptrend
Ensure that the market has been moving upward before the pattern appears.
Without an uptrend, the signal may not be valid.
Step 2: Spot the Hanging Man
Check whether the candle has:
- A small real body
- A long lower shadow
- Minimal upper shadow
Step 3: Wait for Confirmation
Allow the next candle to confirm the bearish signal.
Avoid entering trades too early.
Step 4: Enter the Trade
Some traders enter a short position after confirmation.
Others may use the signal to exit existing long positions.
Step 5: Set a Stop Loss
Risk management is crucial.
A common approach is placing the stop loss above the high of the Hanging Man candle.
Step 6: Define Profit Targets
Determine realistic profit targets using:
- Support levels
- Risk-to-reward ratios
- Technical indicators
Having a clear exit strategy improves trading discipline.
Advantages of the Hanging Man Candle
The Hanging Man pattern offers several benefits.
Easy to Identify
Its unique structure makes it relatively simple to recognize on charts.
Provides Early Warning Signals
It alerts traders to possible trend weakness before a major reversal occurs.
Works Across Markets
The pattern can be used in:
- Stocks
- Forex
- Commodities
- Indices
- Cryptocurrencies
Improves Risk Awareness
It encourages traders to review their positions and manage exposure carefully.
Limitations of the Hanging Man Candle
Despite its usefulness, the pattern has limitations.
False Signals
Not every Hanging Man leads to a reversal.
Markets may continue moving upward despite the warning sign.
Requires Confirmation
Using the pattern without confirmation can lead to poor trading decisions.
Less Effective in Sideways Markets
The signal works best after strong uptrends.
In range-bound conditions, its reliability decreases.
Should Not Be Used Alone
Combining it with other analysis methods improves effectiveness.
Hanging Man vs Hammer Candle
Many beginners confuse the Hanging Man with the Hammer candle because they look similar.
The main difference lies in their location.
Hanging Man Candle
- Appears after an uptrend.
- Indicates a potential bearish reversal.
- Suggests weakening buying momentum.
Hammer Candle
- Appears after a downtrend.
- Indicates a potential bullish reversal.
- Suggests buyers may regain control.
Understanding the context of the pattern is more important than its appearance alone.
Tips for Using the Hanging Man Candle Effectively
To get the most value from this pattern:
- Always confirm the signal before trading.
- Use stop losses to protect capital.
- Combine candlestick analysis with indicators.
- Avoid emotional decision-making.
- Practice using historical charts before trading with real money.
- Maintain proper risk management at all times.
Consistency and discipline are often more important than any single trading pattern.
Conclusion
The Hanging Man candle is a valuable bearish reversal pattern that can help traders identify potential changes in market direction. Its small body and long lower shadow reveal that sellers are beginning to challenge the existing uptrend.
However, the pattern should never be viewed as a guaranteed signal. Waiting for confirmation, combining it with technical indicators, and applying sound risk management can significantly improve trading decisions.
Whether you are a beginner learning technical analysis or an experienced trader refining your strategy, understanding the Hanging Man candle can enhance your ability to interpret market sentiment and react more confidently to changing market conditions.
By practicing patience and following a disciplined approach, traders can use the Hanging Man candle as one of many tools to navigate the financial markets more effectively.