
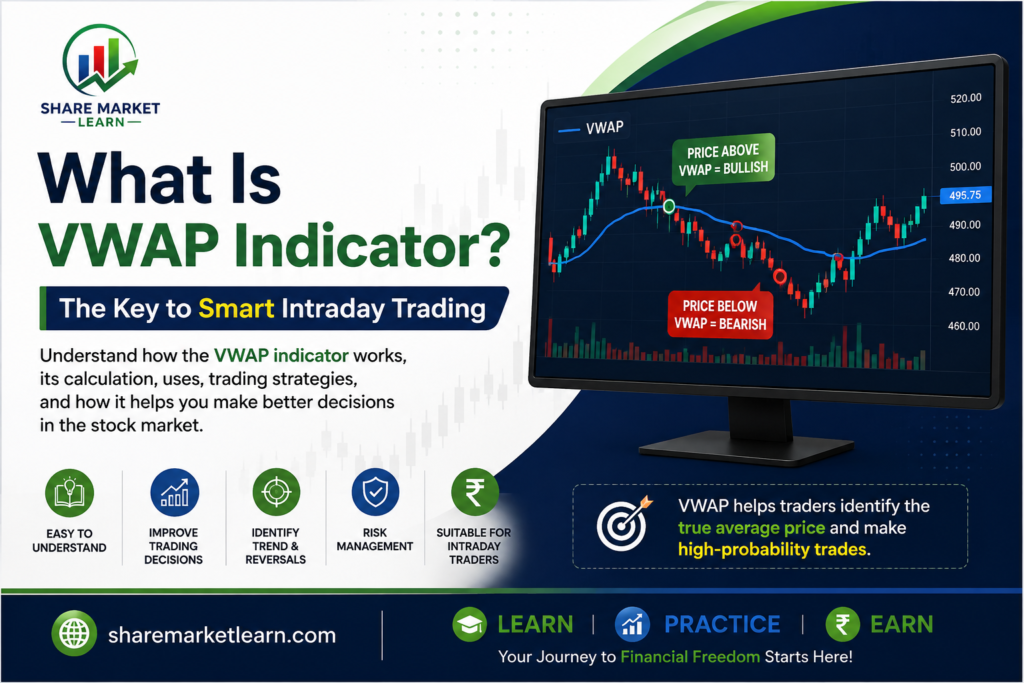
If you are learning technical analysis or intraday trading, you may have come across the term VWAP indicator. VWAP is widely used by traders to understand the average price at which an asset has traded during a particular trading session.
But what does VWAP actually mean? How is it calculated? How can traders use it? And is VWAP suitable for beginners?
In this guide, we will explain what the VWAP indicator is, how it works, how to read it on a trading chart, and some common VWAP trading strategies in simple language.
Important: This article is for educational purposes only. Trading and investing involve market risk. No technical indicator can guarantee profits.
What Is VWAP Indicator?
VWAP stands for Volume Weighted Average Price.
The VWAP indicator calculates the average price of an asset during a trading session while giving more importance to prices where greater trading volume occurred.
In simple words, VWAP helps answer this question:
“At what average price has most of the trading taken place?”
Unlike a simple moving average, VWAP considers both price and volume.
For example, if a stock trades heavily around ₹500, that price level has more influence on VWAP than a price where only a small number of shares were traded.
This makes VWAP particularly useful for intraday traders.
How Does VWAP Work?
VWAP is calculated using price and volume data.
The basic formula is:
VWAP = Cumulative (Price × Volume) ÷ Cumulative Volume
Most trading platforms calculate VWAP automatically, so traders generally do not need to calculate it manually.
Let’s look at a simple example.
Suppose a stock trades during the day at:
- ₹100 with 1,000 shares
- ₹102 with 2,000 shares
- ₹104 with 1,000 shares
The VWAP gives greater importance to the ₹102 price because more shares were traded there.
Therefore, VWAP provides a volume-weighted view of the average traded price.
Why Is VWAP Important?
VWAP can help traders understand the relationship between the current market price and the average price of trading activity.
For example:
Price Above VWAP
When the price is trading above VWAP, it can indicate that buyers are currently stronger compared with the average traded price of the session.
Some traders may interpret this as a sign of intraday strength.
Price Below VWAP
When the price trades below VWAP, it can indicate weaker price action compared with the session’s average traded price.
Some traders may view this as intraday weakness.
However, VWAP should not be treated as a standalone buy or sell signal.
Market conditions, price structure, volume, and other indicators should also be considered.
VWAP vs Moving Average
VWAP and moving averages may look similar on a chart, but they are different.
A moving average primarily calculates an average of prices over a selected number of periods.
VWAP incorporates volume into the calculation and is commonly reset at the beginning of each trading session when using standard session VWAP.
For example:
Moving Average: Focuses mainly on price over a selected period.
VWAP: Combines price and volume during the trading session.
This difference makes VWAP especially popular among intraday traders.
How to Use VWAP Indicator in Trading
There are several ways traders use VWAP.
1. VWAP as a Trend Filter
One simple approach is to observe whether the price is above or below VWAP.
If the price consistently stays above VWAP and forms higher highs and higher lows, traders may consider the market to have stronger bullish momentum.
If the price remains below VWAP and forms lower highs and lower lows, traders may consider the market weaker.
This can help traders avoid taking trades against the broader intraday direction.
2. VWAP as Support
Sometimes VWAP can act as a dynamic support area.
Imagine a stock is moving upward and remains above VWAP.
The price pulls back toward VWAP and then starts moving upward again.
Some traders may consider this a possible continuation setup.
However, VWAP is not guaranteed to act as support every time. A price can break through it at any moment.
3. VWAP as Resistance
VWAP can also sometimes act as resistance.
Suppose a stock is trading below VWAP.
The price moves upward toward VWAP but struggles to move above it.
Some traders may interpret this as a potential sign of continued weakness.
Again, traders should look for confirmation rather than entering a trade simply because price touches VWAP.
VWAP Breakout Strategy
Another common approach is a VWAP breakout.
For example, suppose a stock has been trading below VWAP for some time.
Then the stock moves strongly above VWAP with increased volume.
A trader may interpret this as a possible shift in intraday momentum.
However, one should be careful about false breakouts.
A price may temporarily move above VWAP and then fall back below it.
Therefore, traders may look for additional confirmation such as:
- Strong volume
- A clear candle close
- Higher highs and higher lows
- Support from the broader market
- Confirmation from another technical indicator
VWAP Pullback Strategy
The VWAP pullback strategy is another popular approach.
Suppose a stock breaks above VWAP and starts moving higher.
Instead of immediately entering after the breakout, a trader may wait for the price to pull back toward VWAP.
If the price finds support and starts moving higher again, it may create a potential trade setup.
The idea is to enter closer to a potential support area rather than chasing the price after a large move.
Risk management remains important because the price can also break below VWAP.
VWAP for Intraday Trading
VWAP is especially popular among day traders because traditional session VWAP generally starts fresh each trading session.
It can provide a reference point for the day’s trading activity.
For example:
Price above VWAP + strong volume + bullish price structure
may indicate stronger intraday conditions.
On the other hand:
Price below VWAP + weak price structure + selling volume
may indicate weaker conditions.
These are observations, not guaranteed trading signals.
VWAP and Volume
One of the biggest advantages of VWAP is its connection with volume.
Volume tells traders how much activity is taking place.
VWAP combines this information with price to provide a weighted average.
This can help traders understand whether the current price is significantly above or below the session’s volume-weighted average.
For example, a stock trading only slightly above VWAP with strong buying volume may present a different situation from a stock trading far above VWAP after a sharp price spike.
Context matters.
Common Mistakes When Using VWAP
Beginners often make a few common mistakes.
Using VWAP Alone
VWAP should not be treated as a guaranteed buy or sell indicator.
Entering Immediately at VWAP
Price touching VWAP does not automatically mean a reversal will happen.
Ignoring Volume
Because VWAP is volume-weighted, volume analysis can provide useful additional context.
Trading Without a Stop-Loss Plan
Every trading strategy needs risk management.
Overtrading
A trader may take multiple trades simply because price repeatedly crosses VWAP.
Instead, it is better to wait for clear setups and confirmation.
Advantages of VWAP Indicator
Some important advantages include:
- Easy to understand
- Combines price and volume
- Useful for intraday analysis
- Can help identify market bias
- Can act as a reference for support and resistance
- Available on most modern charting platforms
VWAP can be particularly useful when combined with price action and volume analysis.
Limitations of VWAP
VWAP is not perfect.
It is primarily designed to describe the average traded price during a session, so it may be less useful for some longer-term trading approaches unless using an anchored or other customized VWAP method.
It can also produce unclear signals in choppy markets where price repeatedly crosses the VWAP line.
Most importantly, VWAP cannot predict the future.
It describes past and current trading activity rather than guaranteeing what price will do next.
VWAP and Other Indicators
Some traders combine VWAP with other technical tools, such as:
- Moving averages
- RSI
- MACD
- Support and resistance
- Candlestick patterns
- Volume
- Market structure
For example, a trader may look for a price move above VWAP combined with strong volume and a bullish chart structure.
Using multiple pieces of information can provide more context than relying on one indicator alone.
Is VWAP Good for Beginners?
Yes, VWAP can be a useful indicator for beginners because its basic concept is relatively easy to understand.
Start by learning three things:
- What VWAP represents
- How price behaves around VWAP
- How volume and price structure confirm or contradict a VWAP signal
Before using real money, beginners should consider practicing on historical charts or using a paper-trading environment.
The goal should be to understand the behavior of the indicator rather than simply memorizing a buy or sell rule.
Conclusion
So, what is VWAP indicator?
VWAP, or Volume Weighted Average Price, is a technical analysis indicator that calculates the average traded price of an asset while taking trading volume into account.
It is widely used by intraday traders to understand whether the current market price is above or below the session’s volume-weighted average price.
VWAP can be used as a trend filter and may sometimes act as support or resistance. Traders can also use it when studying breakouts, pullbacks, volume, and intraday market structure.
However, VWAP should not be considered a magic indicator. Markets can move unexpectedly, and no indicator guarantees profits.
For beginners, the best approach is to combine VWAP with price action, volume, risk management, and proper trading discipline.
Frequently Asked Questions (FAQs)
1. What does VWAP stand for?
VWAP stands for Volume Weighted Average Price.
2. What does VWAP tell traders?
VWAP shows the average traded price of an asset during a trading session, weighted according to trading volume.
3. Is VWAP useful for intraday trading?
Yes. VWAP is particularly popular among intraday traders because it provides a session-based reference for average traded price.
4. What does it mean when price is above VWAP?
Price above VWAP can indicate relative intraday strength, especially when supported by strong volume and bullish price structure. It is not automatically a buy signal.
5. What does it mean when price is below VWAP?
Price below VWAP can indicate relative intraday weakness. Traders often combine this observation with volume and price action before making a decision.
6. Is VWAP better than a moving average?
Neither is universally better. VWAP incorporates volume and is particularly useful for intraday analysis, while moving averages can be used across many different timeframes and strategies.
7. Can VWAP be used for swing trading?
Standard session VWAP is mainly used for intraday analysis. Traders interested in longer-term analysis may explore Anchored VWAP, which can be anchored to a specific event or price point.
8. Can VWAP guarantee profitable trades?
No. VWAP is a technical analysis tool, not a prediction system. Proper risk management is essential.
9. Which timeframe is best for VWAP?
VWAP can be viewed on different intraday chart timeframes. The most suitable timeframe depends on the trader’s strategy and trading style.
10. Can VWAP be combined with RSI?
Yes. Some traders combine VWAP with RSI, volume, price action, and support/resistance to obtain additional market context. However, combining indicators does not guarantee better results.