
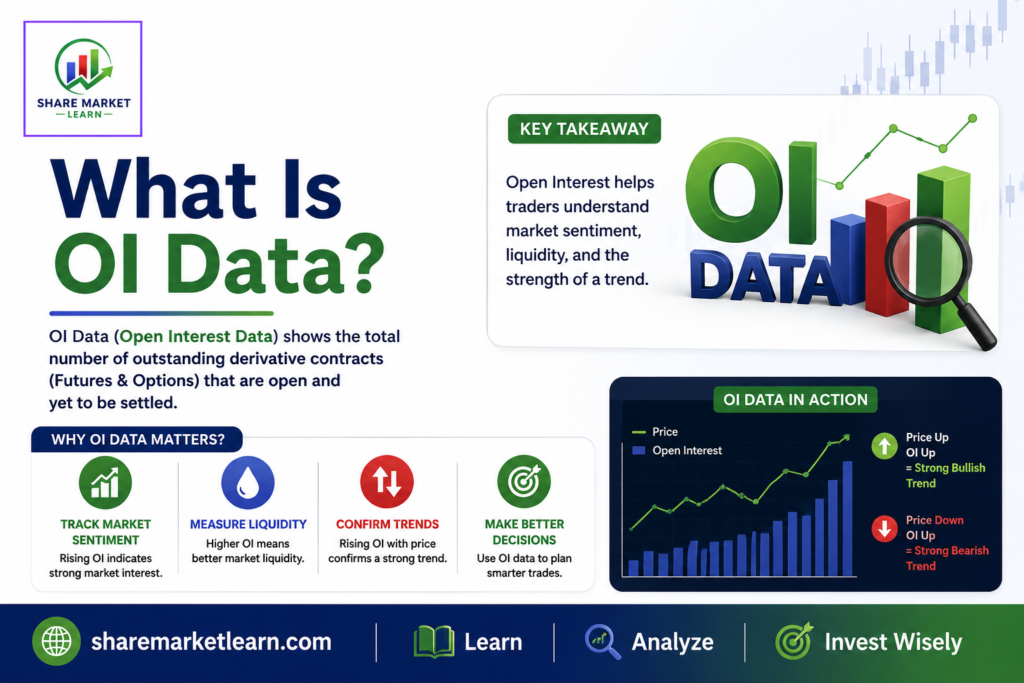
If you are learning stock market trading, you may have heard traders talking about OI Data or Open Interest Data. OI is especially important in the futures and options market because it can provide useful information about market participation, positioning, and possible changes in sentiment.
But what exactly is OI data? How is it calculated? What does an increase or decrease in OI mean? And how can beginners use it along with price and volume?
In this simple guide, we will explain what OI data is, how Open Interest works, how to read OI changes, OI vs volume, and how traders use OI data in futures and options trading.
What Is OI Data ?
OI stands for Open Interest.
Open Interest represents the total number of outstanding futures or options contracts that are still open and have not yet been closed, exercised, or expired.
In simple words, OI tells you how many derivative contracts are currently active in the market.
For example, suppose traders create 10,000 new futures contracts. If these contracts remain open, the Open Interest is 10,000 contracts.
OI can increase or decrease as traders enter new positions or close existing positions.
This makes Open Interest Data useful for understanding how much money and participation may be involved in a particular futures or options contract.
How Does Open Interest Work?
To understand OI, imagine two traders.
Trader A wants to buy a futures contract, while Trader B wants to sell a new futures contract.
When they create a new contract between them, Open Interest increases by one contract.
Now imagine that both traders later close their positions.
That contract disappears from the list of outstanding contracts, so Open Interest decreases by one.
The important point is that OI measures open contracts, not simply the number of times a contract has been traded.
What Does Increasing OI Mean?
When Open Interest increases, it generally means that new positions are being created in the market.
However, increasing OI by itself does not tell you whether traders are bullish or bearish.
You need to look at price movement along with OI.
For example:
Price rising + OI rising
This can indicate that new positions are being created while prices are moving upward. Traders often interpret this as a sign of strengthening bullish participation.
Price falling + OI rising
This can indicate increasing participation while prices are moving lower. It is often interpreted as stronger bearish positioning.
These interpretations are useful, but they are not guaranteed predictions.
What Does Decreasing OI Mean?
When Open Interest decreases, it generally indicates that existing positions are being closed.
Again, you should combine OI with price movement.
For example:
Price rising + OI falling
This can indicate that existing short positions are being closed. Traders often call this short covering.
Price falling + OI falling
This can indicate that existing long positions are being closed. This is commonly referred to as long unwinding.
Understanding these combinations can make OI analysis much easier.
Price and OI Interpretation
A simple way to understand OI data is to compare price + Open Interest.
Here is a commonly used framework:
| Price | OI | Common Interpretation |
|---|---|---|
| Rising | Rising | Long buildup |
| Falling | Rising | Short buildup |
| Rising | Falling | Short covering |
| Falling | Falling | Long unwinding |
These terms are commonly used by traders to describe changes in derivatives positioning.
However, they should not be treated as guaranteed signals.
Market conditions, volume, volatility, expiry, news, and the specific derivative contract can all affect the interpretation.
What Is Long Buildup?
Long buildup generally refers to a situation where the price is rising and Open Interest is also increasing.
This suggests that new positions are being added while the price is moving upward.
For example:
- Price: ₹1,000 → ₹1,050
- OI: 10 lakh → 12 lakh contracts
This combination may indicate increasing bullish participation.
Traders may look for long buildup when analyzing a bullish market.
What Is Short Buildup?
Short buildup generally refers to a situation where price is falling while Open Interest is increasing.
For example:
- Price: ₹1,000 → ₹950
- OI: 10 lakh → 13 lakh contracts
This may suggest that new bearish positions are being created.
Traders may interpret this as increasing selling pressure.
What Is Short Covering?
Short covering generally occurs when the price rises while Open Interest falls.
Imagine traders previously created short positions expecting prices to fall.
If the market starts rising, those traders may close their short positions by buying back the contracts.
This buying activity can push prices higher.
For example:
- Price: ₹1,000 → ₹1,050
- OI: 15 lakh → 12 lakh contracts
This combination may indicate short covering.
What Is Long Unwinding?
Long unwinding generally occurs when price falls while Open Interest also decreases.
Traders who previously held long positions may close them because they expect weaker prices.
For example:
- Price: ₹1,000 → ₹950
- OI: 15 lakh → 11 lakh contracts
This may indicate that existing bullish positions are being closed.
OI vs Volume: What Is the Difference?
Beginners often confuse Open Interest and Volume.
They are different.
Volume
Volume represents the number of contracts traded during a particular period.
For example, if 50,000 contracts are traded today, the daily volume may be 50,000 contracts.
Open Interest
Open Interest represents the number of contracts that remain open.
So:
Volume = contracts traded
OI = contracts still open
A contract can contribute to trading volume without necessarily increasing Open Interest because some trades involve closing existing positions.
Why Is OI Data Important?
OI data can help traders understand market participation and positioning.
Some of its common uses include:
1. Understanding Market Sentiment
Changes in price and OI can provide clues about whether bullish or bearish positions may be increasing.
2. Identifying Possible Trends
OI can be used alongside price action to assess whether a trend appears to have increasing participation.
3. Analyzing Futures
Futures traders often monitor OI to understand how positions are changing.
4. Analyzing Options
Options traders can examine OI at different strike prices to understand where large numbers of contracts are outstanding.
5. Finding Potential Support and Resistance
Large Open Interest at particular option strikes is sometimes watched as a possible area of interest.
However, high OI does not automatically mean that a price level will act as support or resistance.
How Is OI Used in Options Trading?
OI is particularly popular among options traders.
For example, suppose a stock is trading around ₹1,000.
Traders might look at the Open Interest for different strikes:
- ₹950 Put
- ₹1,000 Put
- ₹1,050 Call
- ₹1,100 Call
If certain strikes have significantly higher OI, traders may pay attention to those levels.
Some traders use changes in Call OI and Put OI to understand potential market positioning.
However, OI should be combined with other information such as option price, volume, implied volatility, price action, and expiry.
OI Data During Options Expiry
OI can become especially interesting as an options expiry approaches.
Traders may monitor how Open Interest changes at different strike prices.
For example, if Call OI is concentrated around a particular strike, traders may watch that level closely. Similarly, significant Put OI may attract attention around another strike.
But option markets can change rapidly, particularly close to expiry.
Therefore, beginners should avoid assuming that the strike with the highest OI will definitely act as a support or resistance level.
Common Mistakes When Using OI Data
Mistake 1: Looking at OI Alone
OI should not be analyzed independently.
Always compare it with price, volume, and market structure.
Mistake 2: Assuming High OI Means Strong Support
High Put OI does not guarantee support.
Similarly, high Call OI does not guarantee resistance.
Mistake 3: Confusing OI With Volume
Volume measures trading activity during a period, while OI measures outstanding contracts.
Mistake 4: Ignoring Expiry
OI can change significantly as contracts approach expiry.
Mistake 5: Treating OI as a Guaranteed Signal
OI provides information, not certainty.
Market conditions can change quickly due to news, economic events, institutional activity, and unexpected volatility.
How Beginners Can Use OI Data
If you are new to Open Interest analysis, keep your approach simple.
Start by observing:
1. Price direction
Is the price moving up or down?
2. OI direction
Is Open Interest increasing or decreasing?
3. Volume
Is trading activity increasing?
4. Important price levels
Are there major support or resistance levels nearby?
5. Confirmation
Does price action support the OI interpretation?
By combining these factors, you can develop a better understanding of what may be happening in the derivatives market.
Final Thoughts
OI Data, or Open Interest Data, is an important tool for futures and options traders. It shows the number of outstanding derivative contracts and can help traders understand changes in market participation.
The easiest way to remember the basic combinations is:
Price ↑ + OI ↑ = Long buildup
Price ↓ + OI ↑ = Short buildup
Price ↑ + OI ↓ = Short covering
Price ↓ + OI ↓ = Long unwinding
However, OI should never be treated as a standalone buy or sell signal. Combining price action, OI, volume, support and resistance, and other technical indicators can provide a more complete picture of the market.
For beginners, the best approach is to study historical charts and observe how price and OI behave together. With practice, Open Interest can become a useful part of your trading analysis.
Frequently Asked Questions
1. What is OI in the stock market?
OI means Open Interest. It represents the total number of outstanding futures or options contracts that remain open.
2. What does rising OI mean?
Rising OI generally means that the number of open derivative positions is increasing. To understand whether the activity is bullish or bearish, traders usually compare OI with price movement.
3. What does falling OI mean?
Falling OI generally means that existing derivative positions are being closed.
4. What is the difference between OI and volume?
Volume measures how many contracts are traded during a period. OI measures how many contracts remain open.
5. What is long buildup?
Long buildup generally means price is rising and OI is rising, suggesting increasing bullish participation.
6. What is short buildup?
Short buildup generally means price is falling and OI is rising, suggesting increasing bearish participation.
7. What is short covering?
Short covering generally occurs when price rises while OI falls, as traders close previously established short positions.
8. What is long unwinding?
Long unwinding generally occurs when price falls while OI falls, indicating that existing long positions may be getting closed.
9. Is OI data useful for options trading?
Yes. Options traders frequently monitor OI at different strike prices, along with price, volume, implied volatility, and other market data.
10. Can OI predict the market direction?
OI can provide useful clues about market positioning, but it cannot reliably predict future prices by itself. It should be combined with other forms of analysis.