
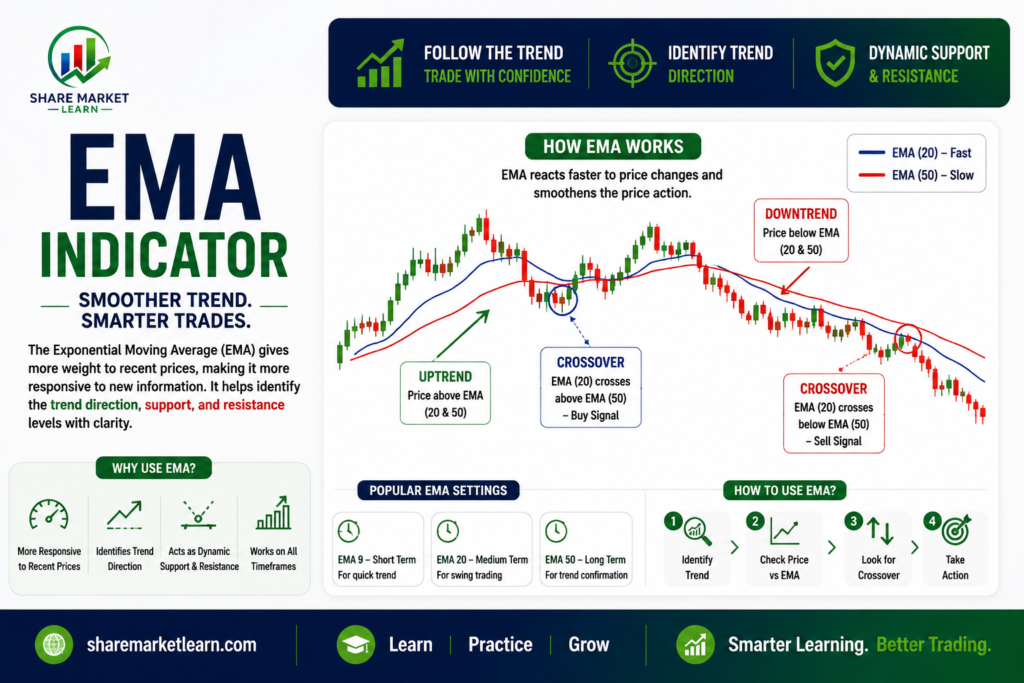
The Exponential Moving Average (EMA) is one of the most popular technical indicators used by traders and investors to identify market trends, find entry and exit points, and make informed trading decisions. Unlike the Simple Moving Average (SMA), the EMA gives more weight to recent price data, making it more responsive to price changes.
Whether you trade stocks, forex, cryptocurrencies, or commodities, understanding the EMA Indicator can help you better analyze market trends and improve your trading strategy.
In this article, you’ll learn what the EMA Indicator is, how it works, how it is calculated, the best EMA settings, trading strategies, advantages, disadvantages, and common mistakes to avoid.
What Is the EMA Indicator?
The Exponential Moving Average (EMA) is a trend-following technical indicator that smooths price data while placing greater importance on the most recent prices. This allows the EMA to react more quickly to market movements than the Simple Moving Average.
Traders use the EMA to:
- Identify market trends.
- Spot potential buy and sell opportunities.
- Confirm trend reversals.
- Find dynamic support and resistance levels.
Because it responds quickly to price changes, the EMA is especially popular among short-term and swing traders.
How Does the EMA Indicator Work?
The EMA continuously updates based on the latest closing prices.
- If prices are rising, the EMA moves upward.
- If prices are falling, the EMA moves downward.
- Recent price movements have a greater impact than older data.
This responsiveness helps traders identify trend changes earlier than many other moving averages.
How Is the EMA Calculated?
The EMA calculation uses a multiplier that gives more weight to recent prices.
The basic process is:
- Calculate the Simple Moving Average (SMA) for the selected period.
- Determine the multiplier:
Multiplier = 2 ÷ (Period + 1)
- Apply the EMA formula:
EMA = (Current Price − Previous EMA) × Multiplier + Previous EMA
Fortunately, most trading platforms automatically calculate the EMA, so traders don’t need to perform these calculations manually.
Best EMA Settings
Different EMA periods suit different trading styles.
Short-Term Trading
- EMA 5
- EMA 9
- EMA 10
These EMAs react quickly and are commonly used by day traders and scalpers.
Swing Trading
- EMA 20
- EMA 21
- EMA 50
These settings help identify medium-term trends and pullback opportunities.
Long-Term Investing
- EMA 100
- EMA 200
These are widely used to identify long-term bullish and bearish trends.
How to Read the EMA Indicator
Price Above EMA
When the price stays above the EMA, it usually indicates an uptrend.
Many traders look for buying opportunities during pullbacks to the EMA.
Price Below EMA
When the price remains below the EMA, it generally signals a downtrend.
Traders may look for selling opportunities or avoid buying against the trend.
EMA Turning Upward
An upward-sloping EMA suggests increasing bullish momentum.
EMA Turning Downward
A downward-sloping EMA indicates growing bearish momentum.
Popular EMA Trading Strategies
1. EMA Crossover Strategy
One of the most common strategies uses two EMAs.
Example:
- 9 EMA
- 21 EMA
Buy Signal
When the 9 EMA crosses above the 21 EMA, it may indicate the start of an uptrend.
Sell Signal
When the 9 EMA crosses below the 21 EMA, it may suggest a downtrend.
2. Price Pullback Strategy
During a strong trend:
- Wait for the price to retrace toward the EMA.
- Enter the trade when the price resumes moving in the direction of the trend.
This strategy helps traders enter with better risk-reward ratios.
3. EMA Support and Resistance
The EMA often acts as dynamic support during an uptrend and dynamic resistance during a downtrend.
Many traders use this behavior to identify potential entry and exit points.
4. Multiple EMA Strategy
Some traders combine three EMAs, such as:
- 20 EMA
- 50 EMA
- 200 EMA
This combination provides a broader view of short-, medium-, and long-term trends.
Advantages of the EMA Indicator
Reacts Faster to Price Changes
The EMA responds more quickly than the SMA because it gives greater weight to recent prices.
Easy to Use
The indicator is simple to understand and suitable for beginners.
Works Across Markets
EMA can be applied to:
- Stocks
- Forex
- Cryptocurrencies
- Commodities
- Indices
Suitable for Different Timeframes
It works well on intraday, daily, weekly, and monthly charts.
Helps Identify Trends
The EMA makes it easier to recognize trend direction and potential reversals.
Limitations of the EMA Indicator
False Signals
During sideways or range-bound markets, EMA crossovers may produce false buy and sell signals.
Lagging Indicator
Although EMA reacts faster than SMA, it still follows price and cannot predict future market movements.
Not Enough on Its Own
EMA should be combined with volume, support and resistance, and other indicators for better accuracy.
Common Mistakes to Avoid
Many traders make these mistakes:
- Using only one EMA without confirmation.
- Ignoring the overall market trend.
- Trading every EMA crossover.
- Entering trades without a stop-loss.
- Forgetting to manage risk.
Avoiding these mistakes can improve long-term trading performance.
Best Indicators to Combine with EMA
For better trading decisions, combine EMA with:
RSI (Relative Strength Index)
Helps confirm momentum and identify overbought or oversold conditions.
MACD
Provides additional confirmation for trend strength and reversals.
Bollinger Bands
Useful for identifying volatility and potential price reversals.
Volume Indicator
Higher volume during a breakout strengthens the EMA signal.
Support and Resistance
Combining EMA with key price levels improves entry and exit accuracy.
Tips for Using EMA Successfully
- Choose EMA settings that match your trading style.
- Wait for confirmation before entering trades.
- Follow the overall market trend.
- Use stop-loss orders to manage risk.
- Avoid trading solely based on EMA crossovers.
- Backtest your strategy before using it in live markets.
EMA vs SMA: What’s the Difference?
| Feature | EMA | SMA |
|---|---|---|
| Weight Given | More weight to recent prices | Equal weight to all prices |
| Speed | Faster response | Slower response |
| Best For | Short-term trading | Long-term trend analysis |
| Sensitivity | High | Moderate |
Both indicators are useful, but EMA is generally preferred by active traders because it responds more quickly to changing market conditions.
Conclusion
The EMA Indicator is one of the most effective trend-following tools in technical analysis. By giving greater importance to recent price data, it helps traders identify trends, spot potential entry and exit points, and react more quickly to market changes.
However, like any indicator, the EMA should not be used in isolation. Combining it with indicators such as RSI, MACD, volume analysis, and support and resistance can improve trading accuracy. Consistent practice, disciplined risk management, and a well-tested strategy are the keys to long-term trading success.
Frequently Asked Questions (FAQs)
1. What is the EMA Indicator?
The EMA (Exponential Moving Average) is a moving average that gives more weight to recent price data, making it more responsive to market changes than the Simple Moving Average.
2. Which EMA is best for trading?
The best EMA depends on your trading style. Common settings include 9 EMA and 21 EMA for short-term trading, 20 EMA and 50 EMA for swing trading, and 200 EMA for long-term trend analysis.
3. Is EMA better than SMA?
EMA reacts faster to recent price movements, making it popular for active traders. SMA provides smoother signals and is often preferred for identifying long-term trends.
4. Can beginners use the EMA Indicator?
Yes. The EMA is easy to understand and is suitable for beginners, especially when combined with other technical analysis tools.
5. Does EMA work in all markets?
Yes. EMA can be used in stocks, forex, cryptocurrencies, commodities, and indices across different timeframes.
6. Should EMA be used alone?
No. For better accuracy, combine EMA with indicators like RSI, MACD, volume analysis, and support and resistance levels.