
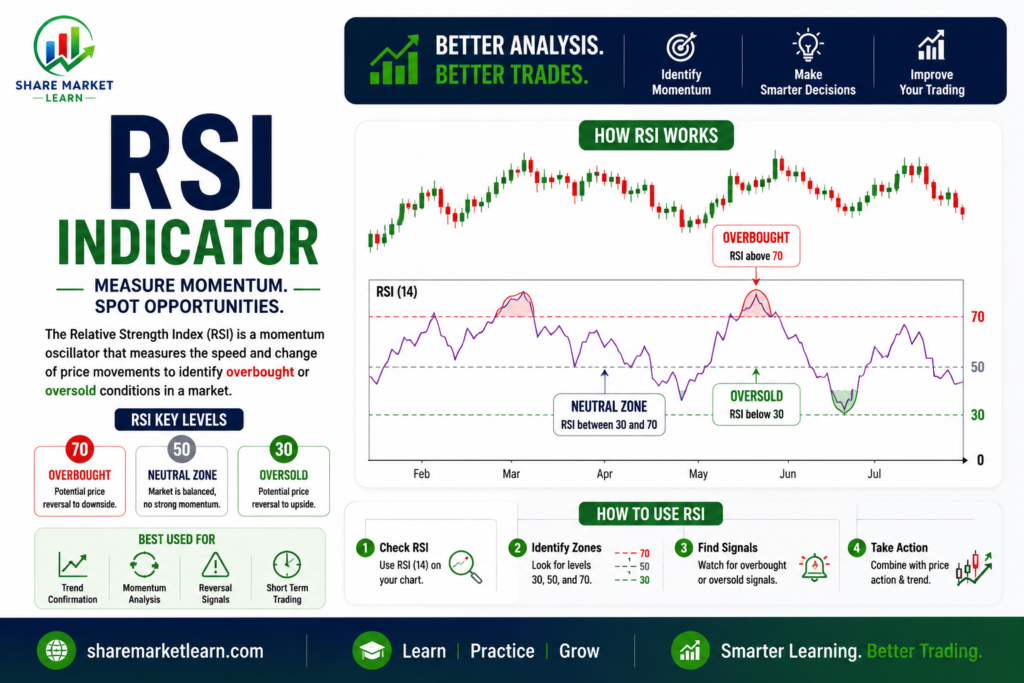
The Relative Strength Index (RSI) is one of the most widely used technical indicators in the stock market, forex, cryptocurrency, and commodity trading. Developed by J. Welles Wilder Jr. in 1978, the RSI helps traders identify whether an asset is overbought, oversold, or showing signs of a potential trend reversal.
Whether you’re new to trading or looking to improve your technical analysis skills, understanding the RSI Indicator can help you make more informed trading decisions.
In this guide, you’ll learn what RSI is, how it works, how to calculate it, how to interpret its signals, popular trading strategies, advantages, disadvantages, and common mistakes to avoid.
What Is the RSI Indicator?
The Relative Strength Index (RSI) is a momentum oscillator that measures the speed and strength of recent price movements. It compares the average gains and average losses over a specific period to determine whether an asset is gaining or losing momentum.
The RSI value ranges from 0 to 100.
Generally:
- Above 70 indicates an overbought market.
- Below 30 indicates an oversold market.
- Around 50 represents a neutral market.
Traders use these levels to identify potential buying and selling opportunities.
Who Created the RSI Indicator?
The RSI was developed by J. Welles Wilder Jr., a renowned technical analyst who also introduced several other popular indicators, including:
- Average True Range (ATR)
- Parabolic SAR
- Average Directional Index (ADX)
His work continues to influence modern technical analysis.
How Does the RSI Indicator Work?
The RSI measures the balance between recent upward and downward price movements.
- When buyers are stronger, the RSI moves higher.
- When sellers dominate, the RSI moves lower.
- Strong buying pressure pushes RSI above 70.
- Strong selling pressure pushes RSI below 30.
This helps traders understand market momentum before making trading decisions.
RSI Formula
The RSI is calculated using the following formula:
- Calculate the average gain over the selected period.
- Calculate the average loss over the same period.
- Divide the average gain by the average loss to get the Relative Strength (RS).
- Apply the RSI formula:
RSI = 100 − [100 ÷ (1 + RS)]
Most charting platforms automatically calculate RSI, so traders rarely need to perform the calculation manually.
Default RSI Settings
The most commonly used RSI setting is:
- Period: 14
However, traders sometimes use different settings based on their trading style.
Short-Term Trading
- RSI 7
- RSI 9
These settings react faster but may produce more false signals.
Swing Trading
- RSI 14
The standard setting that balances responsiveness and reliability.
Long-Term Trading
- RSI 21
This setting generates fewer but more reliable signals.
How to Read the RSI Indicator
RSI Above 70
When RSI rises above 70, the market may be overbought.
This doesn’t always mean the price will fall immediately, but it suggests buyers may be losing momentum.
RSI Below 30
When RSI falls below 30, the market may be oversold.
This could indicate that selling pressure is weakening and a price rebound may occur.
RSI Around 50
An RSI near 50 usually reflects a balanced market without strong bullish or bearish momentum.
Best RSI Trading Strategies
1. Overbought and Oversold Strategy
This is the most common RSI strategy.
- Buy when RSI moves below 30 and then turns upward.
- Sell or book profits when RSI rises above 70 and starts falling.
2. RSI Divergence
Divergence occurs when the price and RSI move in opposite directions.
Bullish Divergence
- Price makes a lower low.
- RSI makes a higher low.
This may indicate a bullish reversal.
Bearish Divergence
- Price makes a higher high.
- RSI makes a lower high.
This may signal a bearish reversal.
3. RSI with Trend Confirmation
Use RSI alongside moving averages.
- In an uptrend, look for RSI pullbacks toward 40–50 before buying.
- In a downtrend, look for RSI rallies toward 50–60 before selling.
This approach helps traders align trades with the broader trend.
4. RSI Swing Rejection
Swing rejection occurs when RSI:
- Falls below 30.
- Moves back above 30.
- Pulls back slightly.
- Continues higher.
This pattern can provide an early bullish signal.
Advantages of the RSI Indicator
Easy to Understand
Its simple 0–100 scale makes it beginner-friendly.
Identifies Momentum
RSI helps traders assess the strength of price movements.
Works Across Markets
It can be used in:
- Stocks
- Forex
- Cryptocurrency
- Commodities
- Indices
Suitable for Multiple Timeframes
The RSI works on intraday, daily, weekly, and monthly charts.
Supports Better Timing
It helps traders identify potential entry and exit points.
Limitations of the RSI Indicator
False Signals
During strong trends, RSI may remain overbought or oversold for extended periods.
Not a Standalone Tool
Using RSI alone can lead to poor decisions. Combine it with price action, trendlines, or support and resistance.
Sensitive Settings
Lower RSI periods generate more signals but also increase the chance of false alarms.
Common Mistakes Traders Make
Avoid these common errors:
- Buying immediately because RSI is below 30.
- Selling immediately because RSI is above 70.
- Ignoring the overall market trend.
- Using RSI without confirmation from other indicators.
- Trading without a stop-loss.
Good risk management is essential regardless of the indicator used.
Best Indicators to Combine with RSI
For more reliable signals, pair RSI with:
Moving Averages
Confirm the direction of the trend.
MACD
Identify momentum changes and trend reversals.
Bollinger Bands
Spot potential price reversals when combined with RSI extremes.
Support and Resistance
Improve entry and exit timing by combining RSI with key price levels.
Tips for Using RSI Successfully
- Use the default 14-period setting unless you have a specific strategy.
- Wait for confirmation before entering a trade.
- Avoid trading solely based on overbought or oversold conditions.
- Combine RSI with volume and price action.
- Always follow proper risk management.
- Practice on historical charts before trading with real money.
Conclusion
The RSI Indicator is one of the most effective and beginner-friendly momentum indicators available. It helps traders measure market strength, identify overbought and oversold conditions, and spot potential reversals.
However, no indicator is perfect. The best results come from combining RSI with trend analysis, support and resistance, volume, and disciplined risk management. By practicing consistently and following a well-defined trading plan, traders can use RSI as a valuable part of their technical analysis toolkit.
Frequently Asked Questions (FAQs)
1. What is the RSI Indicator?
The RSI (Relative Strength Index) is a momentum indicator that measures the speed and strength of recent price movements on a scale of 0 to 100.
2. What does RSI above 70 mean?
An RSI above 70 generally suggests the asset may be overbought and could be due for a pullback, although strong trends can keep RSI above 70 for some time.
3. What does RSI below 30 indicate?
An RSI below 30 usually indicates an oversold market, which may signal a potential price rebound if buying pressure returns.
4. What is the best RSI setting?
The default 14-period RSI is the most commonly used setting and works well for many trading styles.
5. Can beginners use RSI?
Yes. RSI is easy to understand and is one of the best indicators for beginners when combined with proper risk management and confirmation tools.
6. Should RSI be used alone?
No. It is best used alongside other indicators such as Moving Averages, MACD, Bollinger Bands, and support/resistance levels for stronger trading decisions.