
If you have started learning about stock market trading or technical analysis, you may have heard traders talking about EMA 50 and EMA 200.
These two indicators are among the most commonly used moving averages on price charts. Traders use them to understand the market trend, identify potential support and resistance areas, and look for possible buy or sell signals.
But what exactly do EMA 50 and EMA 200 mean? How are they different from each other? And how can beginners use them without making their charts unnecessarily complicated?
In this guide, we will explain everything in simple language.
What Is EMA?
EMA stands for Exponential Moving Average.
A moving average calculates the average price of an asset over a specific number of periods. The EMA is different from a simple moving average because it gives more weight to recent prices.
This means an EMA reacts more quickly to recent price changes.
For example, a 50 EMA calculates an average based on the previous 50 periods while giving greater importance to the more recent prices.
The same concept applies to the 200 EMA, but it uses 200 periods.
The period can represent different timeframes. For example:
- On a daily chart, 50 EMA represents approximately 50 trading days.
- On an hourly chart, 50 EMA represents 50 hourly candles.
- On a 15-minute chart, 50 EMA represents 50 fifteen-minute candles.
So, the meaning of EMA 50 or EMA 200 depends on the timeframe you are viewing.
What Is EMA 50?
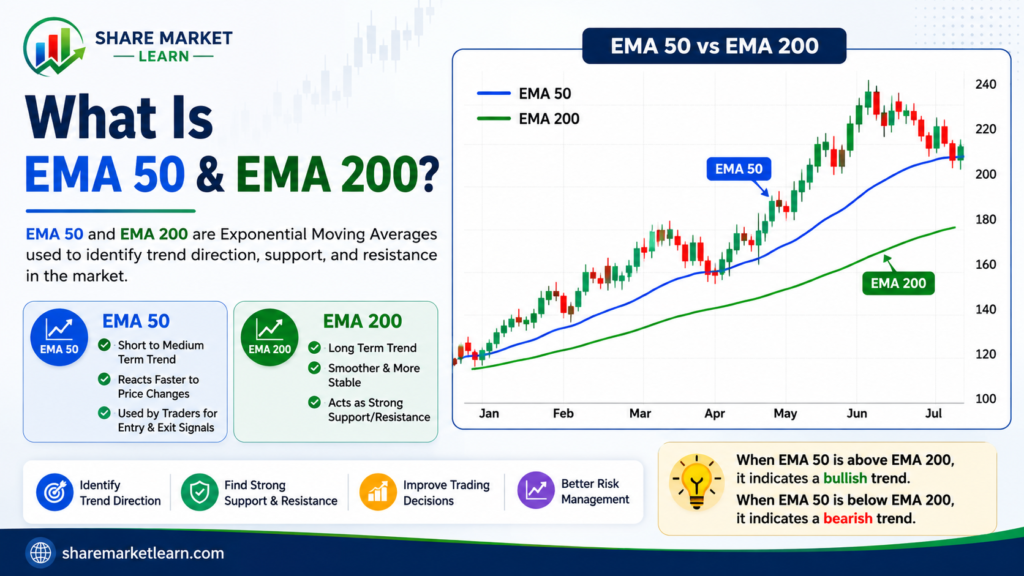
The 50 EMA is a medium-term trend indicator.
Because it reacts more quickly to price changes than the 200 EMA, traders often use it to understand the current or intermediate trend.
When the price is consistently above the 50 EMA, it can suggest that buyers are currently stronger.
When the price remains below the 50 EMA, it can suggest that sellers are stronger.
However, this should not be treated as a guaranteed buy or sell signal.
Why Do Traders Use the 50 EMA?
Traders commonly use the 50 EMA for:
- Identifying the current trend
- Finding potential dynamic support
- Finding potential dynamic resistance
- Understanding price momentum
- Looking for trend-following opportunities
For example, during an uptrend, the price may repeatedly pull back toward the 50 EMA and then move higher again.
In such situations, some traders watch the 50 EMA as a potential support area.
What Is EMA 200?
The 200 EMA is a long-term trend indicator.
Because it considers a much larger number of periods, it moves more slowly than the 50 EMA.
The 200 EMA is widely watched because it can provide a broad picture of the market’s long-term direction.
When price is above the 200 EMA, traders may consider the longer-term trend relatively bullish.
When price is below the 200 EMA, traders may consider the longer-term trend relatively bearish.
Again, the EMA itself does not predict what will happen next. It simply helps traders interpret price behavior.
EMA 50 vs EMA 200
The biggest difference between EMA 50 and EMA 200 is the period they measure.
| Feature | EMA 50 | EMA 200 |
|---|---|---|
| Period | 50 | 200 |
| Trend type | Medium-term | Long-term |
| Reaction to price | Faster | Slower |
| Common use | Current/intermediate trend | Major/long-term trend |
| Potential role | Support/resistance | Major support/resistance |
Think of it this way:
EMA 50 = faster view of the trend
EMA 200 = slower, broader view of the trend
Using both together can help traders understand how the shorter-term trend compares with the longer-term trend.
What Is the 50 EMA and 200 EMA Crossover?
One of the most popular strategies involving these two indicators is the EMA crossover.
A crossover occurs when one EMA moves above or below another EMA.
Bullish Crossover
When the 50 EMA crosses above the 200 EMA, traders often refer to this as a Golden Cross.
It is generally viewed as a potentially bullish signal because the shorter-term trend is becoming stronger relative to the longer-term trend.
However, the signal can occur after a large part of a price move has already happened.
Bearish Crossover
When the 50 EMA crosses below the 200 EMA, it is commonly called a Death Cross.
Traders may interpret this as a potentially bearish signal because the shorter-term trend is weakening relative to the longer-term trend.
Like the Golden Cross, a Death Cross should not be treated as a guaranteed prediction.
How to Use EMA 50 & EMA 200 Together
Using both EMAs can provide a simple way to analyze market direction.
1. Price Above Both EMAs
If the price is above both the 50 EMA and 200 EMA, it may indicate a relatively strong bullish environment.
Traders may then look for opportunities to buy pullbacks rather than immediately entering after a large price increase.
2. Price Below Both EMAs
If the price is below both EMAs, it may indicate a bearish environment.
Some traders may focus more on avoiding long positions or looking for bearish setups.
3. Price Between the Two EMAs
If the price is between the 50 EMA and 200 EMA, the market may be less clear.
This can be a period where traders wait for stronger confirmation instead of making quick decisions.
4. 50 EMA Above 200 EMA
When the 50 EMA is above the 200 EMA, it generally suggests that the medium-term trend is stronger than the long-term trend.
This is often associated with a bullish market structure.
5. 50 EMA Below 200 EMA
When the 50 EMA is below the 200 EMA, it can indicate a weaker medium-term trend relative to the long-term trend.
This is generally associated with bearish market conditions.
EMA 50 & EMA 200 as Support and Resistance
Another common use of these indicators is identifying dynamic support and resistance.
Unlike traditional horizontal support and resistance levels, moving averages move along with the price.
For example, during a strong uptrend, the 50 EMA may act as an area where price finds support.
The 200 EMA can also act as an important long-term support area.
During a downtrend, these moving averages may instead act as resistance.
However, price can break through an EMA at any time. Therefore, traders should look at the overall market structure instead of assuming that an EMA will always hold.
Example of EMA 50 & EMA 200
Imagine a stock is trading at ₹500.
The price moves steadily upward and remains above both its 50 EMA and 200 EMA.
The 50 EMA is also above the 200 EMA.
This combination suggests that the market has a relatively positive trend.
Now imagine the stock starts falling and reaches the 50 EMA.
Instead of buying immediately, a trader might wait to see whether the price finds support and begins moving higher again.
If the price breaks below the 50 EMA, the trader may then watch the 200 EMA as another important area.
This approach uses the EMAs as part of a larger decision-making process rather than relying on one indicator.
Common Mistakes Beginners Should Avoid
Treating EMA Crossovers as Guaranteed Signals
A Golden Cross does not guarantee that prices will rise.
Similarly, a Death Cross does not guarantee that prices will fall.
Markets can reverse unexpectedly.
Using Only One Indicator
EMA 50 and EMA 200 can provide useful information, but they should ideally be combined with other analysis.
Traders may also consider support and resistance, volume, price action, market structure, and risk management.
Ignoring the Timeframe
An EMA 50 on a 5-minute chart is very different from an EMA 50 on a daily chart.
Always understand which timeframe you are analyzing.
Entering Too Late
A crossover happens after the two moving averages have already responded to price movements.
Therefore, entering a trade solely because a crossover has occurred can sometimes mean entering after a significant move.
Are EMA 50 and EMA 200 Good for Beginners?
Yes. EMA 50 and EMA 200 are relatively simple indicators for beginners to understand.
They can help you answer two basic questions:
What is the medium-term trend?
The 50 EMA can help.
What is the longer-term trend?
The 200 EMA can help.
The key is to use them as tools for understanding market conditions rather than as automatic buy and sell buttons.
Conclusion
The EMA 50 and EMA 200 are popular technical analysis indicators that help traders understand market trends.
The 50 EMA reacts more quickly to price changes and is commonly used to study medium-term momentum. The 200 EMA reacts more slowly and is often used to understand the longer-term trend.
When used together, they can provide a simple picture of market direction. Traders also watch the 50 EMA and 200 EMA crossover, including the Golden Cross and Death Cross.
However, no indicator works perfectly in every market condition. The best approach is to combine EMA analysis with price action, support and resistance, volume, and proper risk management.
For beginners, start by observing how price behaves around the 50 EMA and 200 EMA on historical charts. With practice, you can develop a better understanding of how these indicators work in real market conditions.
Frequently Asked Questions
What does EMA 50 mean?
EMA 50 means a 50-period Exponential Moving Average. It gives greater weight to recent prices and is commonly used to understand medium-term market trends.
What does EMA 200 mean?
EMA 200 is a 200-period Exponential Moving Average. It reacts more slowly to price changes and is commonly used to study longer-term trends.
What happens when EMA 50 crosses EMA 200?
When the 50 EMA crosses above the 200 EMA, it is commonly called a Golden Cross. When it crosses below the 200 EMA, it is called a Death Cross.
Is EMA 50 or EMA 200 better?
Neither is universally better. The 50 EMA provides a faster view of price trends, while the 200 EMA provides a broader long-term view. Using both can provide more context.
Can I use EMA 50 and EMA 200 for intraday trading?
Yes. They can be used on intraday charts, but the signals can be more sensitive to market noise on shorter timeframes. Traders should consider the timeframe and overall market conditions.
Should I buy when the price crosses above the 50 EMA?
Not necessarily. A price crossing above the 50 EMA is only one piece of information. Consider trend direction, support and resistance, volume, price action, and risk management before making a trading decision.
Is the 200 EMA a strong support level?
The 200 EMA can act as an important dynamic support or resistance area, but it is not guaranteed to hold. Price can break through it depending on market conditions.