
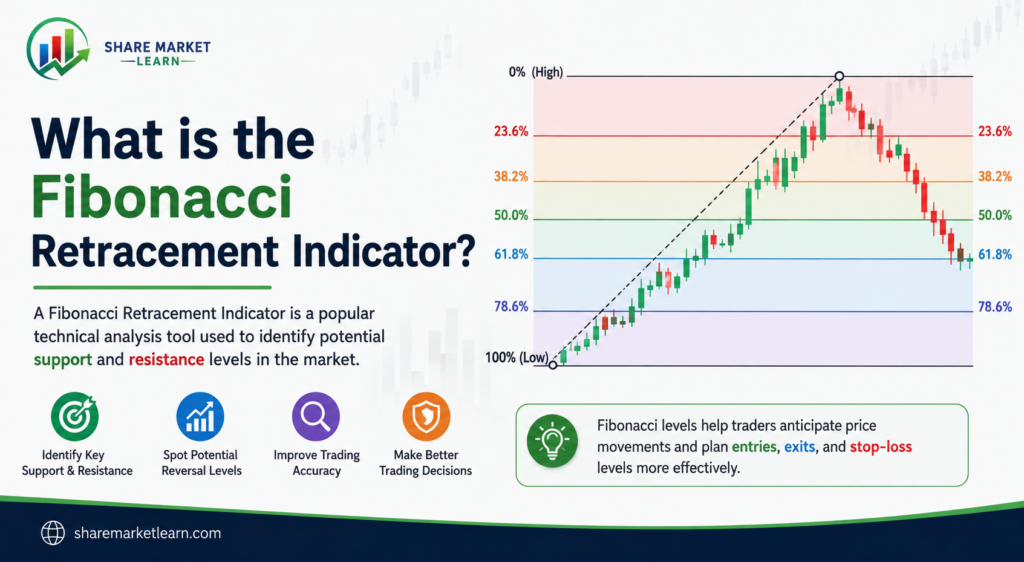
If you are new to technical analysis or trading, you may have come across the term Fibonacci Retracement Indicator. It is one of the most popular tools used by traders to identify potential support and resistance levels on a price chart.
The name may sound complicated, but the basic idea is quite simple. Fibonacci retracement helps traders estimate where the price of an asset might temporarily pull back before continuing in its original direction.
In this guide, we will explain what the Fibonacci Retracement Indicator is, how it works, how to use it, and some common mistakes beginners should avoid.
What Is the Fibonacci Retracement Indicator?
The Fibonacci Retracement Indicator is a technical analysis tool based on a sequence of numbers discovered by mathematician Leonardo Fibonacci.
In trading, the indicator uses specific percentage levels to identify areas where a market may retrace, or move temporarily against, its current trend.
The most commonly used Fibonacci retracement levels are:
- 23.6%
- 38.2%
- 50%
- 61.8%
- 78.6%
Among these, the 38.2%, 50%, and 61.8% levels are particularly popular with traders.
For example, imagine a stock rises from ₹100 to ₹200. Instead of assuming that the price will continue moving upward without interruption, a trader may use Fibonacci retracement to identify possible areas where the price could pull back.
The indicator does not predict the future with certainty. Instead, it gives traders potential price zones to watch.
How Does Fibonacci Retracement Work?
Fibonacci retracement is normally applied to a significant price movement.
For an uptrend, traders generally select a swing low and a swing high. The indicator then calculates possible retracement levels between those two points.
For a downtrend, traders usually select a swing high and a swing low.
The idea is that after a strong price movement, the market may retrace part of that move before continuing in the original direction.
For example:
Suppose a stock moves from ₹100 to ₹150.
A trader can apply the Fibonacci Retracement Indicator to this movement. The resulting Fibonacci levels may show potential areas where buyers could become interested if the stock pulls back.
These levels can act as areas of potential support during an uptrend or potential resistance during a downtrend.
Important Fibonacci Retracement Levels
23.6% Level
The 23.6% retracement is relatively shallow. It can appear when the market is experiencing a strong trend and the price makes only a small correction.
A shallow retracement may indicate that the existing trend remains strong, although it should not be treated as confirmation by itself.
38.2% Level
The 38.2% level is widely watched by traders. A price correction toward this area may be considered a normal pullback during a trend.
Traders often combine this level with other technical signals before making a decision.
50% Level
Although 50% is not technically a Fibonacci ratio, traders commonly include it on Fibonacci retracement charts.
It represents a halfway retracement of the previous price movement and can be a useful psychological level in technical analysis.
61.8% Level
The 61.8% level is perhaps the most famous Fibonacci ratio.
It is often called the Golden Ratio and is widely used in technical analysis.
When price reaches this area, traders may watch closely for signs that the original trend could resume.
78.6% Level
The 78.6% level represents a deep retracement.
If the price retraces this far, traders may want to examine the overall market structure carefully because a very deep retracement can sometimes suggest that the original trend is weakening.
How to Use Fibonacci Retracement on a Chart
Using the indicator is relatively straightforward.
Step 1: Identify the Trend
First, determine whether the market is generally moving upward or downward.
Look for a clear trend rather than trying to apply Fibonacci retracement to every small price movement.
Step 2: Find the Important Swing Points
Identify a significant swing high and swing low.
These points should represent a meaningful price movement on the chart.
Step 3: Apply the Fibonacci Tool
Most modern charting platforms have a Fibonacci Retracement tool.
Select the appropriate swing low and swing high, or swing high and swing low, depending on the direction of the trend.
The platform will automatically display the Fibonacci levels.
Step 4: Watch the Price Reaction
Once the levels are visible, observe how the price behaves around them.
A Fibonacci level becomes more interesting when it aligns with other technical signals, such as previous support or resistance, trendlines, moving averages, or chart patterns.
Fibonacci Retracement Example
Imagine that a cryptocurrency moves from ₹1,000 to ₹1,500.
After reaching ₹1,500, the price starts falling.
A trader may use Fibonacci retracement to identify possible areas where the decline could slow down.
Instead of buying immediately when the price reaches a Fibonacci level, the trader might wait for additional confirmation, such as a bullish candlestick pattern or a clear bounce from support.
This is important because Fibonacci levels are potential zones, not guaranteed turning points.
Advantages of Fibonacci Retracement
Fibonacci retracement has several advantages for traders.
Easy to Use
Once you understand swing highs, swing lows, and the major Fibonacci levels, the tool is relatively easy to apply.
Helps Identify Potential Support and Resistance
The indicator can highlight price areas where a reaction may occur.
Useful Across Different Markets
Traders use Fibonacci retracement in stocks, forex, commodities, cryptocurrencies, and other financial markets.
Works With Other Indicators
Fibonacci retracement can be combined with moving averages, trendlines, RSI, MACD, volume, and price-action analysis.
This can help traders create a more complete trading setup.
Common Mistakes Beginners Should Avoid
While Fibonacci retracement can be useful, beginners often make a few common mistakes.
Using Random Swing Points
Selecting random highs and lows can produce unreliable levels.
Try to focus on meaningful price movements and clear market structure.
Treating Fibonacci Levels as Exact Prices
A common mistake is assuming that price must reverse exactly at 61.8% or another level.
Markets rarely behave that precisely. It is generally better to think of Fibonacci levels as potential zones of interest.
Using Fibonacci Alone
Fibonacci retracement should not be treated as a guaranteed trading system.
Combining it with price action, trend analysis, volume, and other indicators can provide better context.
Ignoring the Overall Trend
A Fibonacci level may appear attractive, but the broader market trend is still important.
Always consider what the overall price structure is showing.
Fibonacci Retracement vs. Fibonacci Extension
Fibonacci retracement and Fibonacci extension are related but serve different purposes.
Fibonacci retracement is primarily used to identify potential pullback areas within a price move.
Fibonacci extension is generally used to estimate potential price targets beyond the original high or low.
In simple terms, retracement helps answer:
“Where might the price pull back?”
Extension helps answer:
“Where might the price move next if the trend continues?”
Is Fibonacci Retracement Good for Beginners?
Yes, Fibonacci retracement can be a useful learning tool for beginners because it provides a simple framework for studying market pullbacks.
However, it should not be used as a standalone method for making trading decisions.
A good approach is to combine Fibonacci levels with basic concepts such as:
- Market trends
- Support and resistance
- Candlestick patterns
- Trading volume
- Risk management
- Stop-loss planning
Most importantly, traders should understand that technical indicators work with probabilities rather than guarantees.
Conclusion
The Fibonacci Retracement Indicator is a popular technical analysis tool that helps traders identify potential areas where a market may retrace before continuing its trend.
The most commonly watched levels are 23.6%, 38.2%, 50%, 61.8%, and 78.6%. Among them, the 38.2%, 50%, and 61.8% levels are particularly popular.
For beginners, the key is not to think of Fibonacci levels as magical numbers that predict exactly where the market will reverse. Instead, use them as potential areas of interest and combine them with other forms of analysis.
With practice, Fibonacci retracement can become a useful part of a broader technical-analysis strategy.
Frequently Asked Questions
What is Fibonacci retracement in simple words?
Fibonacci retracement is a charting tool that helps traders identify potential areas where price may temporarily move against the current trend before continuing.
What are the main Fibonacci retracement levels?
The commonly used levels are 23.6%, 38.2%, 50%, 61.8%, and 78.6%.
Is 50% a Fibonacci number?
No. The 50% level is not derived directly from the Fibonacci sequence, but traders commonly include it because markets often react around halfway retracements.
Which Fibonacci level is the most important?
The 61.8% level is widely watched because it relates to the Golden Ratio. However, no single Fibonacci level is guaranteed to work every time.
Can Fibonacci retracement be used for stocks?
Yes. Fibonacci retracement can be used for stocks as well as forex, cryptocurrencies, commodities, and other markets where price charts are available.
Is Fibonacci retracement accurate?
Fibonacci retracement does not guarantee accurate predictions. It is best viewed as a tool for identifying potential support and resistance areas and should be combined with other analysis and proper risk management.
Should beginners use Fibonacci retracement?
Beginners can learn and practice with Fibonacci retracement, but they should first understand basic concepts such as trends, support, resistance, and risk management.