
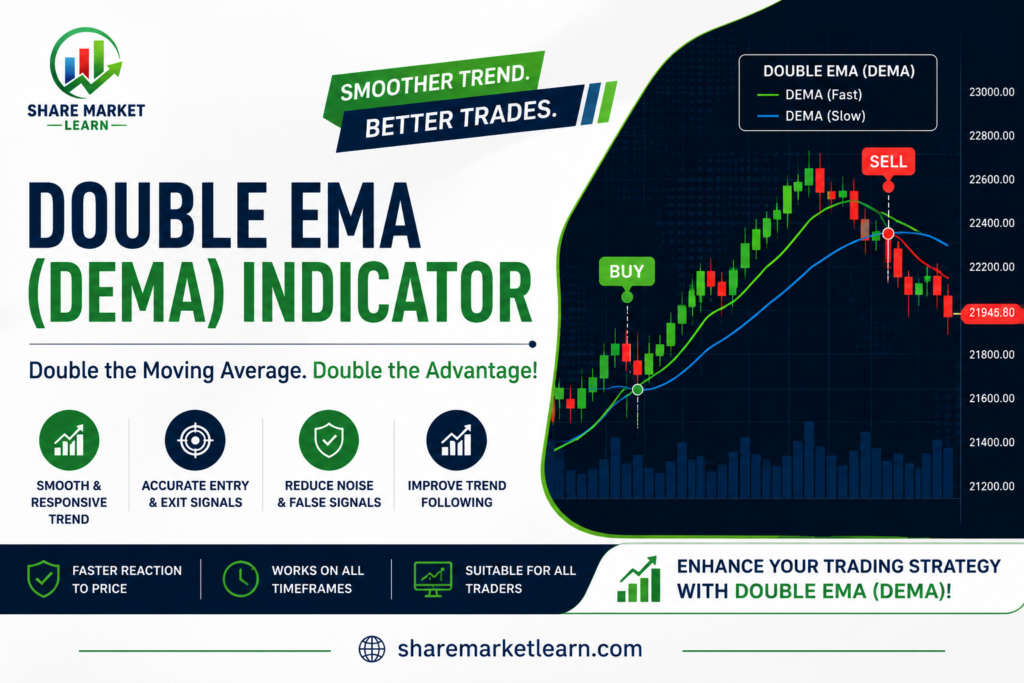
When traders want to understand the direction of a market, moving averages are among the most commonly used technical analysis tools. However, traditional moving averages can sometimes react slowly to changes in price. This is where the Double Exponential Moving Average (DEMA) can be useful.
The Double EMA, commonly known as DEMA, is a technical indicator designed to respond more quickly to price movements than a traditional Exponential Moving Average (EMA). Traders use it to identify trends, potential entry and exit points, and dynamic support or resistance levels.
In this beginner-friendly guide, we will explain what the Double EMA is, how it works, its formula, settings, trading strategies, advantages, limitations, and how it can be combined with other indicators.
What Is the Double EMA Indicator?
The Double Exponential Moving Average (DEMA) is a trend-following moving average developed by Patrick Mulloy and introduced in the early 1990s.
Despite its name, DEMA is not simply an EMA multiplied by two.
Instead, it uses a combination of two EMAs to reduce the lag that is commonly associated with moving averages.
The basic concept is:
DEMA = (2 × EMA) − EMA of the EMA
Because of this calculation, DEMA generally reacts faster to recent price changes than a standard EMA of the same period.
This faster response can be useful for traders who want to identify trend changes earlier.
How Does DEMA Work?
To understand DEMA, it helps to first understand the Exponential Moving Average (EMA).
An EMA gives greater weight to recent prices than older prices. This allows it to respond faster than a Simple Moving Average (SMA).
DEMA takes this idea one step further.
It calculates:
- An EMA of the price.
- An EMA of that first EMA.
- A combination of the two values.
The formula is:
DEMA = (2 × EMA of Price) − (EMA of EMA)
The result is a moving average that attempts to reduce the lag of a traditional EMA while still maintaining smooth price tracking.
DEMA Formula
The mathematical formula for the Double EMA is:
DEMA = 2 × EMA(n) − EMA of EMA(n)
Here, n represents the selected period.
For example, if you use a 20-period DEMA, the calculation involves a 20-period EMA and an EMA applied to that EMA.
You do not need to calculate DEMA manually. Most modern trading platforms provide it as a built-in technical indicator.
DEMA vs EMA
One of the most common questions is the difference between DEMA and EMA.
Both are trend-following indicators, but DEMA is designed to react more quickly to price changes.
EMA
- Smoother price movement
- More lag
- Useful for identifying broader trends
- Can be less sensitive to short-term price changes
DEMA
- Faster response
- Less lag than a comparable EMA
- Useful for identifying trend changes
- Can react more quickly to market noise
This means DEMA may be useful for traders who want a faster moving average, but the increased responsiveness can also produce more false signals.
Common DEMA Settings
There is no single best DEMA setting for every trader.
The appropriate period depends on your trading style and timeframe.
Common periods include:
- 9 DEMA – Short-term trading
- 20 DEMA – Short- to medium-term analysis
- 50 DEMA – Medium-term trend analysis
- 100 DEMA – Longer-term trend analysis
- 200 DEMA – Long-term trend analysis
For beginners, a 20-period or 50-period DEMA can be a good starting point for learning how the indicator behaves.
However, traders should test different settings before using them in a real trading strategy.
How to Use DEMA in Trading
There are several ways traders use the Double EMA.
1. Identifying the Market Trend
The simplest way to use DEMA is to observe the relationship between price and the DEMA line.
When the price stays above a rising DEMA, it may indicate a bullish trend.
When the price stays below a falling DEMA, it may indicate a bearish trend.
For example:
Price above rising DEMA → Potential bullish trend
Price below falling DEMA → Potential bearish trend
This method is simple and can help beginners understand market direction.
2. DEMA Crossover Strategy
A popular strategy is to use two DEMA lines with different periods.
For example:
- Fast DEMA: 20
- Slow DEMA: 50
When the shorter DEMA crosses above the longer DEMA, it may indicate increasing bullish momentum.
When the shorter DEMA crosses below the longer DEMA, it may indicate increasing bearish momentum.
This is known as a DEMA crossover strategy.
However, crossover signals can be unreliable in sideways markets, so additional confirmation is often helpful.
3. DEMA as Dynamic Support and Resistance
A DEMA line can sometimes act as a dynamic support or resistance level.
During an uptrend, price may repeatedly pull back toward the DEMA before continuing higher.
During a downtrend, price may rise toward the DEMA before moving lower again.
Traders can monitor these areas along with traditional support and resistance levels.
4. Identifying Trend Reversals
Because DEMA reacts relatively quickly to price movements, traders may use it to identify potential trend reversals.
For example, if a stock has been trading below a falling DEMA and then breaks above a rising DEMA, it could indicate that momentum is changing.
However, a single price crossover does not guarantee a reversal.
It is better to look for confirmation through volume, price action, market structure, or another indicator.
DEMA for Intraday Trading
DEMA can be used for intraday trading because it reacts relatively quickly to price changes.
Traders may apply it to:
- 5-minute charts
- 15-minute charts
- 30-minute charts
- 1-hour charts
Shorter timeframes can generate more signals, but they can also contain more market noise.
For this reason, traders should avoid entering a trade simply because price crosses the DEMA.
Combining DEMA with market structure and support or resistance can provide better context.
DEMA for Swing Trading
DEMA can also be useful for swing trading.
Swing traders may use periods such as 20, 50, or 100 depending on their strategy.
For example, a trader might use a 50 DEMA to identify the broader trend and then look for pullbacks toward the DEMA before considering a potential entry.
The exact strategy should be tested using historical market data before being applied with real capital.
DEMA With RSI
The Relative Strength Index (RSI) can be combined with DEMA to provide additional momentum confirmation.
For example, a potential bullish setup could occur when:
- Price moves above DEMA.
- DEMA starts rising.
- RSI shows positive momentum.
- Price action confirms the bullish structure.
A potential bearish setup could occur when:
- Price moves below DEMA.
- DEMA starts falling.
- RSI indicates weak momentum.
- Price action confirms bearish conditions.
The goal is not to create a perfect signal but to use multiple pieces of information before making a decision.
DEMA With MACD
DEMA can also be combined with the Moving Average Convergence Divergence (MACD) indicator.
DEMA can help identify the direction of the trend, while MACD can provide additional information about momentum and potential changes in momentum.
This combination may be useful for traders who want trend and momentum confirmation.
Advantages of DEMA
The Double EMA has several advantages.
Faster Than Traditional Moving Averages
DEMA is designed to reduce the lag associated with conventional moving averages.
Useful for Trend Identification
It can provide a clear visual representation of market direction.
Flexible
DEMA can be used for short-term, medium-term, and longer-term analysis.
Easy to Add to Charts
Most modern charting platforms provide DEMA as a built-in indicator.
Useful for Different Markets
It can be applied to stocks, indices, forex, commodities, and other financial instruments.
Limitations of DEMA
DEMA also has some limitations that traders should understand.
More Sensitive to Market Noise
Because DEMA responds quickly, it can react to short-term price fluctuations.
False Signals
During sideways markets, price can repeatedly cross the DEMA and create misleading signals.
Not a Standalone System
DEMA only analyzes price data. It does not account for company fundamentals, economic news, earnings announcements, or other external factors.
No Guaranteed Results
No moving average can accurately predict every market movement.
Tips for Using DEMA
If you are a beginner, keep these tips in mind:
- Understand the overall market trend before trading.
- Do not rely on DEMA alone.
- Use support and resistance for additional confirmation.
- Consider RSI or MACD for momentum confirmation.
- Backtest your DEMA strategy before using real money.
- Use proper stop-loss and position sizing.
- Avoid taking every crossover signal during sideways markets.
The most important part of any trading strategy is risk management.
Conclusion
The Double EMA (DEMA) Indicator is a useful technical analysis tool designed to reduce the lag of traditional moving averages while maintaining a relatively smooth trend line.
Its faster reaction to price changes makes it attractive to traders looking for earlier trend signals. DEMA can be used to identify market direction, monitor crossovers, find potential dynamic support and resistance, and confirm trend changes.
However, its faster response also means it can react to market noise and generate false signals, particularly in sideways conditions.
For beginners, the best approach is to use DEMA as one part of a broader trading strategy. Combining it with price action, support and resistance, RSI, MACD, volume, and proper risk management can provide a more complete view of the market.
Before using any DEMA strategy with real money, test it on historical data and understand its strengths and weaknesses.
Frequently Asked Questions (FAQs)
1. What is the Double EMA?
The Double Exponential Moving Average, or DEMA, is a trend-following indicator designed to reduce the lag of a traditional EMA. It combines an EMA with an EMA of that EMA.
2. What is the formula for DEMA?
The basic formula is:
DEMA = (2 × EMA) − EMA of EMA
It is calculated automatically by most charting platforms.
3. What is the best DEMA setting?
There is no universally best setting. Common periods include 9, 20, 50, 100, and 200. The best choice depends on your trading style, market, and timeframe.
4. Is DEMA better than EMA?
DEMA is not necessarily better than EMA. DEMA generally responds faster and has less lag, while EMA may provide smoother signals. The choice depends on the trader’s strategy.
5. Can DEMA be used for intraday trading?
Yes. DEMA can be used on intraday charts such as 5-minute, 15-minute, and 30-minute timeframes. Traders should be aware that shorter timeframes can produce more false signals.
6. Can DEMA be used for swing trading?
Yes. Swing traders can use DEMA to identify trends and potential pullback opportunities. Periods such as 20, 50, or 100 can be tested depending on the strategy.
7. What indicators work well with DEMA?
DEMA can be combined with RSI, MACD, volume, support and resistance, and price-action analysis for additional confirmation.
8. Does DEMA predict the future price?
No. DEMA is a lagging technical analysis tool based on historical price data. It can help identify trends but cannot guarantee future price movements.
9. Is DEMA suitable for beginners?
Yes. DEMA is relatively easy to understand and can be a useful tool for beginners learning trend analysis. However, beginners should also learn risk management before trading with real money.
10. What is the difference between DEMA and a Double Moving Average?
DEMA is a specific mathematical indicator based on two levels of exponential moving averages. A strategy using two moving averages is different and usually refers to comparing two separate moving-average periods.