
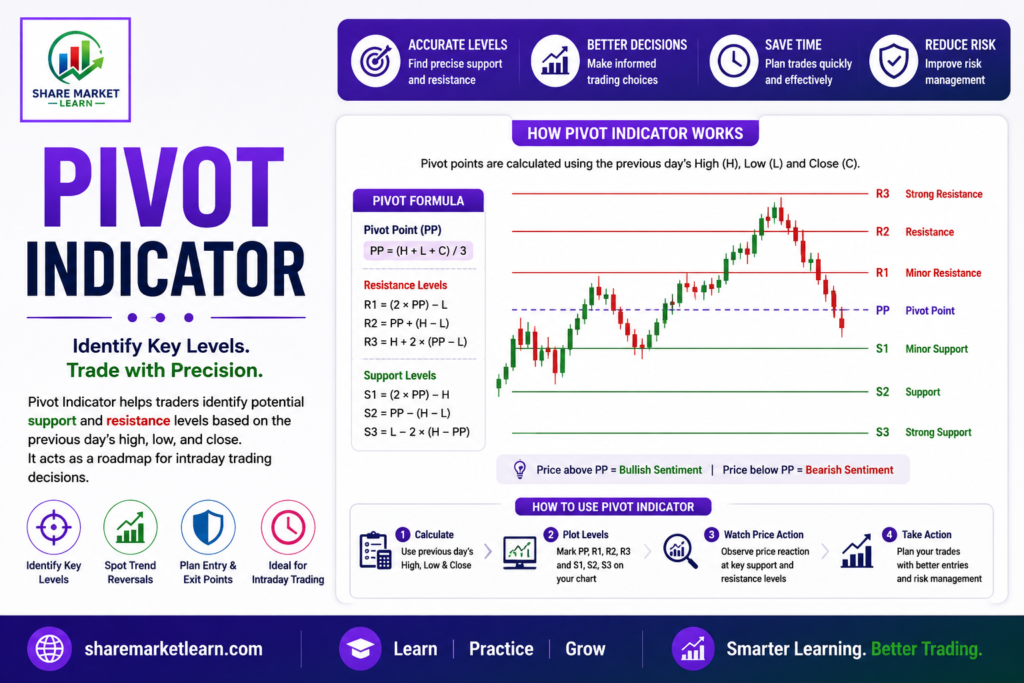
The Pivot Indicator, also known as Pivot Points, is one of the most widely used tools in technical analysis. It helps traders identify important support and resistance levels, determine market direction, and find potential entry and exit points. Pivot Points are especially popular among day traders, swing traders, and intraday traders because they provide clear price levels for making trading decisions.
Unlike many technical indicators that rely on complex calculations, Pivot Points use the previous trading session’s high, low, and closing prices to calculate key price levels for the next trading session.
In this beginner-friendly guide, you’ll learn what the Pivot Indicator is, how it works, how Pivot Points are calculated, trading strategies, advantages, disadvantages, and tips for using them effectively.
What Is the Pivot Indicator?
The Pivot Indicator is a technical analysis tool that calculates a central pivot point along with several support (S1, S2, S3) and resistance (R1, R2, R3) levels.
These levels help traders:
- Identify potential reversal zones.
- Predict support and resistance.
- Plan entry and exit points.
- Set stop-loss and profit targets.
- Determine the overall market trend.
Many professional traders use Pivot Points because they provide objective price levels instead of relying on guesswork.
How Does the Pivot Indicator Work?
The Pivot Indicator is based on the idea that the previous day’s price action influences the next day’s trading.
The indicator calculates:
- One Pivot Point (PP)
- Three Resistance Levels (R1, R2, R3)
- Three Support Levels (S1, S2, S3)
These levels act as potential areas where the price may:
- Reverse direction.
- Pause temporarily.
- Break through with strong momentum.
Traders monitor these levels closely throughout the trading session.
Pivot Point Formula
The basic Pivot Point formula is:
Pivot Point (PP) = (High + Low + Close) ÷ 3
From the Pivot Point, the support and resistance levels are calculated.
Resistance Levels
- R1 = (2 × PP) − Low
- R2 = PP + (High − Low)
- R3 = High + 2 × (PP − Low)
Support Levels
- S1 = (2 × PP) − High
- S2 = PP − (High − Low)
- S3 = Low − 2 × (High − PP)
Fortunately, most charting platforms automatically calculate these levels, so traders can focus on interpreting them instead of performing manual calculations.
Understanding Pivot Levels
Pivot Point (PP)
The central Pivot Point acts as the main reference level.
- Price above PP suggests bullish sentiment.
- Price below PP suggests bearish sentiment.
Resistance Levels (R1, R2, R3)
These levels indicate areas where the price may face selling pressure.
- R1: First resistance
- R2: Stronger resistance
- R3: Major resistance
Support Levels (S1, S2, S3)
These levels indicate areas where buying interest may emerge.
- S1: First support
- S2: Strong support
- S3: Major support
Popular Pivot Point Trading Strategies
1. Trend Trading Strategy
- Buy when the price remains above the Pivot Point.
- Sell when the price remains below the Pivot Point.
This simple approach helps traders trade in the direction of the prevailing trend.
2. Support and Resistance Bounce Strategy
When the price reaches:
- S1 or S2, traders look for buying opportunities if bullish reversal signals appear.
- R1 or R2, traders look for selling opportunities if bearish reversal signals appear.
Confirmation from candlestick patterns or other indicators can improve the reliability of these trades.
3. Breakout Strategy
If the price breaks above a resistance level with strong volume, it may continue higher.
Similarly, if the price breaks below a support level with increased volume, it may continue lower.
Breakout traders often wait for confirmation before entering a trade.
4. Pivot Point with Moving Averages
Many traders combine Pivot Points with:
- EMA (Exponential Moving Average)
- SMA (Simple Moving Average)
This combination helps confirm trend direction and filter out weak signals.
Advantages of the Pivot Indicator
Easy to Use
Pivot Points provide predefined price levels, making them easy for beginners to understand.
Clear Support and Resistance
The indicator offers objective support and resistance levels without manual chart drawing.
Useful for Intraday Trading
Day traders frequently use Pivot Points to identify trading opportunities during the market session.
Works Across Markets
Pivot Points can be used in:
- Stocks
- Forex
- Commodities
- Cryptocurrencies
- Indices
Helps with Risk Management
Support and resistance levels assist in placing stop-loss orders and profit targets.
Limitations of the Pivot Indicator
Based on Historical Data
Pivot Points are calculated using previous price data and cannot predict future events.
False Breakouts
Prices may temporarily break a Pivot level before reversing, creating false signals.
Less Effective in Highly Volatile Markets
Unexpected news or major economic events can cause the price to move beyond Pivot levels quickly.
Needs Confirmation
Using Pivot Points alone may lead to inaccurate trades. Combining them with other technical indicators improves reliability.
Best Indicators to Combine with Pivot Points
To increase accuracy, traders often combine Pivot Points with:
RSI (Relative Strength Index)
Confirms overbought and oversold conditions.
MACD
Helps confirm trend strength and momentum.
EMA
Identifies the overall trend direction.
Bollinger Bands
Measures market volatility and potential reversals.
Volume Indicator
Strong volume at Pivot levels increases the reliability of breakouts or reversals.
Common Mistakes to Avoid
Avoid these common errors:
- Trading every touch of a Pivot level without confirmation.
- Ignoring the overall market trend.
- Forgetting to use a stop-loss.
- Relying solely on Pivot Points.
- Ignoring trading volume.
Proper risk management and confirmation are essential for consistent results.
Tips for Using Pivot Points Successfully
- Use Pivot Points together with price action analysis.
- Confirm signals with volume and momentum indicators.
- Avoid trading during major news events without a clear strategy.
- Follow the dominant trend whenever possible.
- Practice on historical charts before trading with real money.
Pivot Points vs Traditional Support and Resistance
| Feature | Pivot Points | Manual Support & Resistance |
|---|---|---|
| Calculation | Automatic | Drawn manually |
| Objectivity | High | Depends on the trader |
| Best For | Intraday trading | Swing and long-term trading |
| Ease of Use | Easy | Requires experience |
Both methods are valuable, and many traders use them together for better analysis.
Conclusion
The Pivot Indicator is one of the most practical tools for identifying support and resistance levels in financial markets. Its predefined price levels make it especially useful for beginners and active traders who need quick decision-making tools.
While Pivot Points can improve trading accuracy, they should not be used in isolation. Combining them with indicators like RSI, EMA, MACD, Bollinger Bands, and volume analysis can provide stronger confirmation and help reduce false signals. With practice, discipline, and proper risk management, the Pivot Indicator can become a valuable part of any trader’s strategy.
Frequently Asked Questions (FAQs)
1. What is the Pivot Indicator?
The Pivot Indicator is a technical analysis tool that calculates a central Pivot Point and multiple support and resistance levels using the previous trading session’s high, low, and closing prices.
2. How are Pivot Points calculated?
The main Pivot Point is calculated using the formula: (High + Low + Close) ÷ 3. Additional support and resistance levels are derived from this value.
3. Are Pivot Points useful for beginners?
Yes. Pivot Points are easy to understand and provide clear price levels that can help beginners identify potential trading opportunities.
4. Which markets can use Pivot Points?
Pivot Points work well in stocks, forex, commodities, cryptocurrencies, and indices.
5. Can Pivot Points predict future prices?
No. Pivot Points identify potential support and resistance levels but cannot predict future market movements with certainty.
6. Should Pivot Points be used alone?
No. For better results, combine Pivot Points with indicators like RSI, EMA, MACD, Bollinger Bands, and volume analysis.