
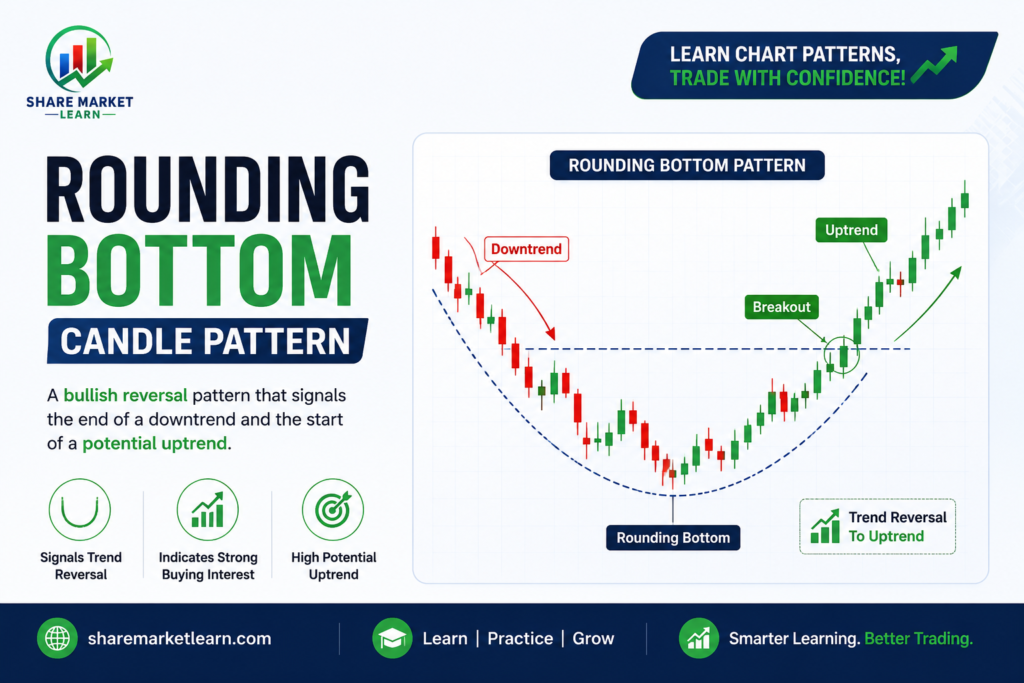
The Rounding Bottom Candle Pattern is one of the most reliable bullish reversal patterns in technical analysis. It indicates that a stock or other financial asset is gradually changing from a downtrend to an uptrend. Because the reversal develops slowly, it often reflects improving market sentiment and increasing buying interest.
Whether you are a beginner or an experienced trader, understanding the Rounding Bottom Pattern can help you identify potential buying opportunities before a significant upward move begins.
In this article, you’ll learn what the Rounding Bottom Candle Pattern is, how it forms, why it works, how to trade it, and the mistakes to avoid.
What is the Rounding Bottom Candle Pattern?
The Rounding Bottom Pattern, often called the Saucer Bottom, is a bullish reversal chart pattern that appears after a prolonged downtrend.
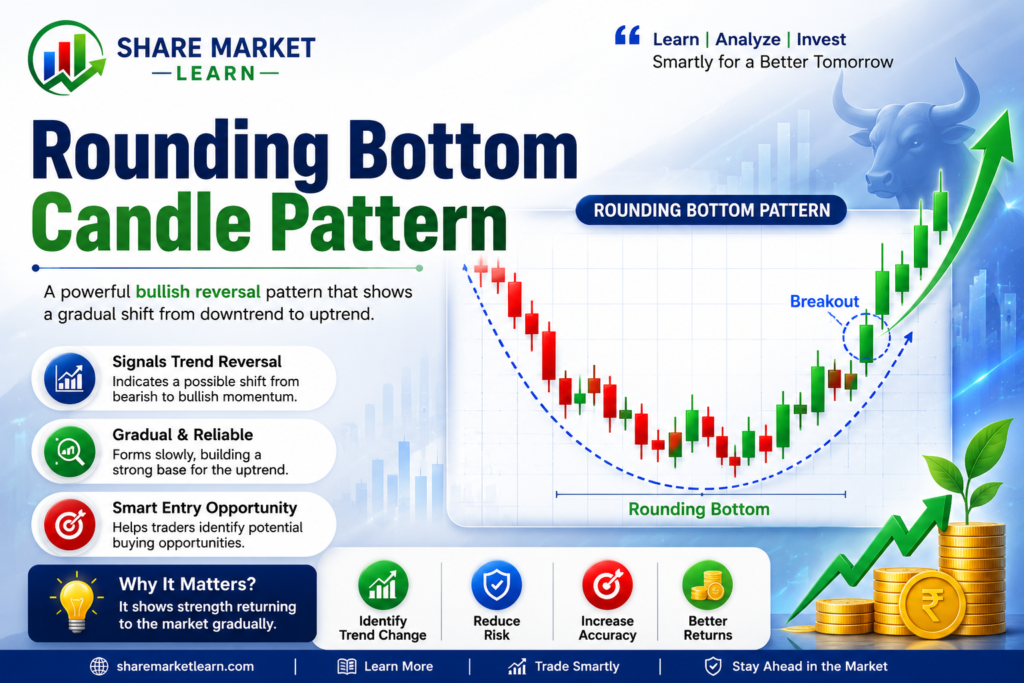
Unlike sharp reversal patterns, this pattern forms gradually. Sellers slowly lose control, buyers begin entering the market, and the price starts moving upward in a smooth, rounded shape.
The pattern resembles the letter “U”, making it easy to recognize once you know what to look for.
Why Does the Rounding Bottom Pattern Form?
The pattern forms because market sentiment changes in stages.
Stage 1: Strong Selling Pressure
The price falls continuously as sellers dominate the market.
Stage 2: Market Stabilizes
Selling pressure starts decreasing. Buyers and sellers become evenly matched, causing the price to move sideways.
Stage 3: Buyers Take Control
Buying volume gradually increases, pushing the price higher. This creates the right side of the rounded “U” shape.
When the price breaks above the resistance level formed at the beginning of the pattern, a bullish breakout is confirmed.
Characteristics of the Rounding Bottom Pattern
A quality Rounding Bottom Pattern usually has the following features:
- Appears after a noticeable downtrend.
- Forms a smooth “U” shape instead of a sharp “V” reversal.
- Selling pressure gradually weakens.
- Buying pressure slowly increases.
- Trading volume often decreases during the bottom formation.
- Volume typically increases during the breakout.
- The breakout above resistance confirms the pattern.
How to Identify the Rounding Bottom Pattern
Follow these simple steps:
1. Look for a Downtrend
The pattern should begin after a clear bearish trend.
2. Find the Rounded Bottom
The price should slowly curve downward and then upward, forming a smooth “U” shape.
3. Watch the Volume
Volume often declines while the pattern forms and rises during the breakout.
4. Wait for Breakout Confirmation
A valid trade usually occurs only after the price closes above the resistance level.
How to Trade the Rounding Bottom Pattern
Entry Point
Enter a buy trade after the price breaks above the resistance with strong volume.
Avoid entering before confirmation because false breakouts can occur.
Stop-Loss
Place the stop-loss:
- Below the breakout candle, or
- Below the lowest point of the rounded bottom, depending on your risk tolerance.
Profit Target
A common target is calculated by measuring the distance from the bottom of the pattern to the resistance level and projecting the same distance above the breakout point.
Example
Imagine a stock falls from ₹500 to ₹350 over several weeks.
Instead of falling further, the price begins moving sideways before gradually rising back toward ₹500.
After several days, the stock closes above ₹500 with strong trading volume.
This breakout confirms the Rounding Bottom Pattern and may signal the start of a new uptrend.
Advantages of the Rounding Bottom Pattern
Reliable Bullish Signal
It often indicates that buyers are gaining long-term control.
Easy to Recognize
The smooth “U” shape makes it relatively simple to identify.
Suitable for Multiple Markets
It works in:
- Stocks
- Forex
- Commodities
- Cryptocurrency
- Indices
Works on Multiple Timeframes
The pattern can be used on daily, weekly, and intraday charts, although higher timeframes generally provide stronger signals.
Limitations
No chart pattern is perfect.
Some limitations include:
- Takes time to develop.
- False breakouts are possible.
- Requires patience.
- Volume confirmation is important.
- Should not be used alone.
Best Indicators to Use with the Rounding Bottom Pattern
Combining this pattern with technical indicators can improve decision-making.
Moving Averages
A breakout above major moving averages adds confidence.
RSI (Relative Strength Index)
An RSI moving above 50 during the breakout may support bullish momentum.
MACD
A bullish MACD crossover can strengthen the signal.
Volume Indicator
Increasing volume during the breakout improves the reliability of the pattern.
Common Mistakes to Avoid
Many beginners make these mistakes:
- Buying before the breakout is confirmed.
- Ignoring trading volume.
- Trading against the overall market trend.
- Forgetting to use a stop-loss.
- Risking too much capital on a single trade.
- Assuming every rounded shape will result in a successful breakout.
Tips for Better Results
To improve your trading success:
- Wait for a confirmed breakout.
- Use volume as confirmation.
- Combine the pattern with other technical indicators.
- Follow proper risk management.
- Trade with the overall market trend whenever possible.
- Maintain a trading journal to review your performance.
Is the Rounding Bottom Pattern Suitable for Beginners?
Yes. The Rounding Bottom Pattern is considered beginner-friendly because its formation is easy to understand and it clearly reflects the shift from bearish to bullish sentiment.
However, beginners should practice identifying the pattern on historical charts and use a demo account before trading with real money.
Conclusion
The Rounding Bottom Candle Pattern is a powerful bullish reversal pattern that helps traders identify potential trend changes after a prolonged decline. Its gradual formation reflects improving buyer confidence and weakening selling pressure.
Although it can provide high-quality trading opportunities, it should always be confirmed with price action, trading volume, and other technical indicators. By combining sound analysis with disciplined risk management, traders can use the Rounding Bottom Pattern as part of a well-rounded trading strategy.
Remember that no pattern guarantees success. Consistency, patience, and proper money management are just as important as recognizing chart patterns.
Frequently Asked Questions (FAQs)
1. Is the Rounding Bottom Pattern bullish?
Yes. It is generally considered a bullish reversal pattern that signals a possible transition from a downtrend to an uptrend.
2. Which timeframe is best for this pattern?
Daily and weekly charts tend to produce more reliable signals, though the pattern can also appear on intraday charts.
3. Should I buy before the breakout?
No. Waiting for a confirmed breakout above resistance helps reduce the risk of false signals.
4. Can this pattern be used in cryptocurrency trading?
Yes. The Rounding Bottom Pattern is commonly used in cryptocurrency, stocks, forex, commodities, and indices.
5. Which indicators work best with this pattern?
Many traders combine it with Moving Averages, RSI, MACD, and Volume analysis for additional confirmation.
6. Is the Rounding Bottom Pattern always successful?
No. Like all technical patterns, it can fail. Proper risk management and confirmation from other indicators are essential.