
The Inverted Head & Shoulders Pattern is one of the most trusted bullish reversal chart patterns in technical analysis. It signals that a downtrend may be coming to an end and that buyers are beginning to take control of the market. Because of its distinctive shape, the pattern is relatively easy to recognize and is widely used by traders in stocks, forex, commodities, cryptocurrencies, and indices.
Unlike a single candlestick pattern, the Inverted Head & Shoulders develops over multiple price swings. When confirmed with a breakout above the neckline, it often provides high-probability buying opportunities.
In this beginner-friendly guide, you’ll learn what the Inverted Head & Shoulders Pattern is, how it forms, the psychology behind it, how to identify and trade it, its advantages, limitations, and common mistakes traders should avoid.
What Is an Inverted Head & Shoulders Pattern?
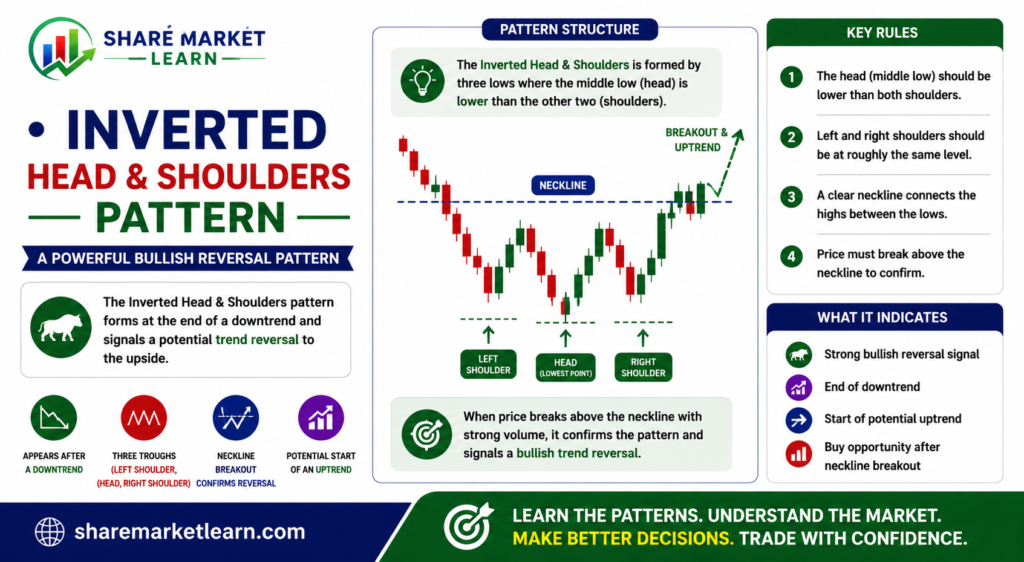
The Inverted Head & Shoulders Pattern is a bullish reversal chart pattern that forms after a prolonged downtrend. It consists of three consecutive lows:
- The left shoulder
- The head (the lowest point)
- The right shoulder
These three lows are connected by a resistance line called the neckline.
The pattern indicates that selling pressure is gradually weakening while buying pressure is increasing. Once the price breaks above the neckline with strong volume, the pattern is considered confirmed, suggesting a potential upward trend.
Structure of the Inverted Head & Shoulders Pattern
The pattern has four key components.
Left Shoulder
- Forms after a downtrend.
- The price falls to a low and then rebounds.
Head
- The price declines again and creates a lower low than the left shoulder.
- Buyers step in and push the price higher.
Right Shoulder
- Sellers attempt another decline.
- The price forms a higher low, showing that selling pressure is weakening.
Neckline
The neckline is drawn by connecting the highs formed between the shoulders and the head. A breakout above this line confirms the pattern.
How Does the Inverted Head & Shoulders Pattern Form?
The pattern develops in several stages.
Stage 1: Strong Downtrend
The market is controlled by sellers, causing prices to decline steadily.
Stage 2: Left Shoulder
The price reaches a temporary low before buyers create a short-term recovery.
Stage 3: Head
Selling resumes and pushes the price to a new low. However, buyers return with stronger momentum, leading to another rally.
Stage 4: Right Shoulder
Sellers try one more time to continue the downtrend, but they fail to create a lower low. This signals weakening bearish momentum.
Stage 5: Breakout
Buyers push the price above the neckline with increased trading volume. This breakout confirms the bullish reversal.
Psychology Behind the Inverted Head & Shoulders Pattern
Understanding the psychology behind this pattern helps traders trust the signal.
During the left shoulder, sellers are still in control, but buyers begin to show interest.
When the head forms, sellers manage to push prices to a new low. However, buyers quickly absorb the selling pressure and drive prices back upward.
By the time the right shoulder develops, sellers can no longer push the market below the previous low. This indicates that bearish momentum is fading.
As the price breaks above the neckline, buyers gain confidence and often enter the market in larger numbers, increasing the probability of a sustained uptrend.
How to Identify an Inverted Head & Shoulders Pattern
Use the following checklist:
- A clear downtrend exists before the pattern.
- Three distinct lows are visible.
- The head is lower than both shoulders.
- The right shoulder is close in height to the left shoulder.
- A neckline connects the two recovery highs.
- The breakout above the neckline occurs with increased trading volume.
The more symmetrical the pattern, the stronger the signal tends to be.
How to Trade the Inverted Head & Shoulders Pattern
Step 1: Wait for Confirmation
Do not enter the trade before the breakout. The pattern is only confirmed after the price closes above the neckline.
Step 2: Enter the Trade
Many traders choose to buy:
- Immediately after the neckline breakout.
- After a successful retest of the neckline as support.
Step 3: Place a Stop Loss
A stop loss is commonly placed:
- Below the right shoulder.
- Below the neckline after a successful retest.
Step 4: Set a Profit Target
One common method is to measure the distance between the head and the neckline and project the same distance above the breakout point.
You can also use:
- Major resistance levels.
- A minimum risk-to-reward ratio of 1:2.
- A trailing stop-loss.
Example of an Inverted Head & Shoulders Pattern
Imagine a stock falls from ₹1,500 to ₹1,000.
- The left shoulder forms around ₹1,050.
- The head forms near ₹980.
- The right shoulder forms around ₹1,060.
- The neckline is located near ₹1,150.
When the price breaks above ₹1,150 with strong trading volume, the Inverted Head & Shoulders Pattern is confirmed, indicating that a bullish reversal may be underway.
Best Indicators to Use with the Inverted Head & Shoulders Pattern
Combining the pattern with technical indicators improves its reliability.
1. Volume
High trading volume during the breakout confirms strong buying interest.
2. Relative Strength Index (RSI)
An RSI moving out of the oversold zone supports the bullish reversal.
3. Moving Averages
A breakout above key moving averages adds strength to the signal.
4. MACD
A bullish MACD crossover can confirm improving market momentum.
5. Support and Resistance
Long-term support levels beneath the pattern increase its reliability.
Advantages of the Inverted Head & Shoulders Pattern
- Strong bullish reversal signal.
- Easy to recognize after practice.
- Suitable for beginners and experienced traders.
- Works across stocks, forex, commodities, cryptocurrencies, and indices.
- Provides clear entry, stop-loss, and target levels.
- Becomes more reliable when combined with technical indicators.
Limitations of the Inverted Head & Shoulders Pattern
Despite its popularity, the pattern has some limitations.
These include:
- False breakouts can occur.
- It requires patience to develop.
- Low trading volume may weaken the breakout.
- News events can invalidate the setup.
- Confirmation is essential before entering a trade.
Recognizing these limitations helps traders avoid unnecessary risks.
Common Mistakes Beginners Make
Many beginners make avoidable errors when trading this pattern.
Common mistakes include:
- Buying before the neckline breakout.
- Ignoring trading volume.
- Placing the stop loss too close.
- Misidentifying similar-looking price movements.
- Ignoring the overall market trend.
- Trading without confirmation from technical indicators.
Avoiding these mistakes can improve trading performance.
Risk Management Tips
Successful trading depends on proper risk management.
Follow these guidelines:
- Never risk more than 1–2% of your trading capital on a single trade.
- Always use a stop loss.
- Aim for a minimum risk-to-reward ratio of 1:2.
- Avoid emotional trading decisions.
- Follow your trading plan consistently.
Good risk management is just as important as finding the right pattern.
Is the Inverted Head & Shoulders Pattern Reliable?
The Inverted Head & Shoulders Pattern is considered one of the most reliable bullish reversal chart patterns because it clearly demonstrates the transition from seller dominance to buyer control.
Its reliability improves when:
- The breakout occurs with strong trading volume.
- The neckline is broken decisively.
- The pattern forms after a prolonged downtrend.
- Indicators such as RSI, MACD, and Moving Averages confirm the breakout.
Although no chart pattern guarantees success, combining this pattern with proper technical analysis and disciplined risk management can significantly improve trading results.
Conclusion
The Inverted Head & Shoulders Pattern is an excellent bullish reversal pattern that helps traders identify potential buying opportunities after a downtrend. Its recognizable structure, clear confirmation rules, and measurable profit targets make it one of the most widely used chart patterns in technical analysis.
However, successful trading requires patience and discipline. Always wait for the neckline breakout, confirm the signal with volume and technical indicators, and apply proper risk management before entering any trade.
By mastering the Inverted Head & Shoulders Pattern, beginners can build a stronger foundation in technical analysis and improve their confidence when making trading decisions.
Frequently Asked Questions (FAQs)
1. What is an Inverted Head & Shoulders Pattern?
It is a bullish reversal chart pattern that forms after a downtrend and signals a potential change from a bearish trend to a bullish trend.
2. Is the Inverted Head & Shoulders a candlestick pattern?
No. It is a chart pattern that develops over multiple candles and price swings.
3. How do I confirm the pattern?
The pattern is confirmed when the price closes above the neckline with increased trading volume.
4. Which timeframe is best for this pattern?
It works on all timeframes, but daily and 4-hour charts generally provide more reliable signals.
5. Can beginners trade this pattern?
Yes. It is suitable for beginners because it has a clear structure and defined entry, stop-loss, and target levels.
6. Which indicators work best with the Inverted Head & Shoulders Pattern?
Volume, RSI, MACD, Moving Averages, and Support & Resistance are commonly used to confirm the pattern.
7. What is the biggest mistake traders make?
The most common mistake is entering a trade before the neckline breakout instead of waiting for proper confirmation.