
The Cup and Handle Pattern is one of the most popular bullish continuation chart patterns in technical analysis. It is widely used by traders and investors to identify potential buying opportunities before a strong upward price movement. The pattern gets its name because it resembles the shape of a tea cup with a small handle.
Unlike a single candlestick pattern, the Cup and Handle is a chart pattern that develops over many candles. It can appear in stocks, forex, commodities, cryptocurrencies, and indices. When the pattern is confirmed with a breakout above the resistance level, it often signals the continuation of an existing uptrend.
In this beginner-friendly guide, you’ll learn what the Cup and Handle Pattern is, how it forms, the psychology behind it, how to identify and trade it, its advantages, limitations, and common mistakes traders should avoid.
What Is a Cup and Handle Pattern?
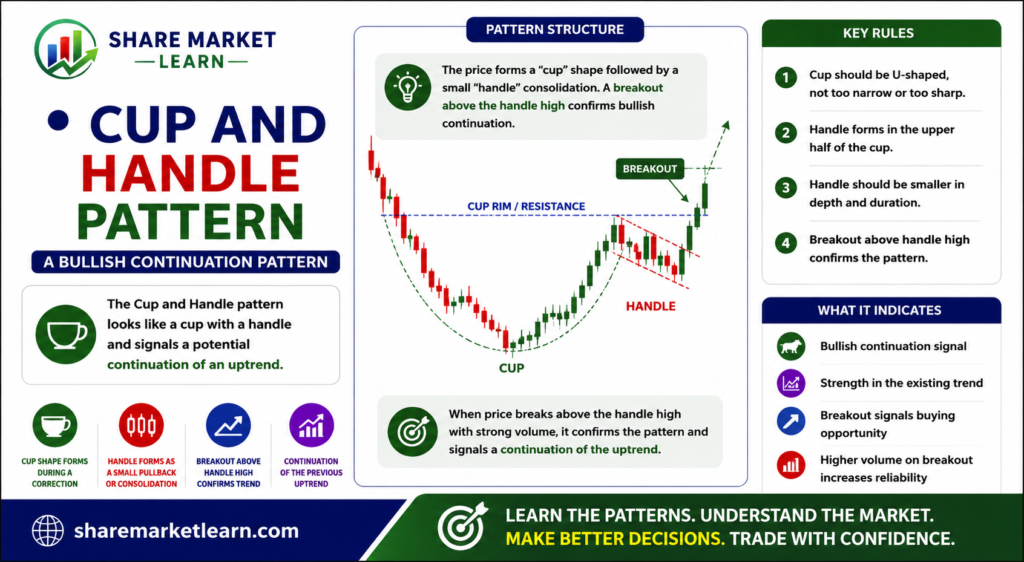
A Cup and Handle Pattern is a bullish continuation chart pattern that forms after an existing uptrend. It consists of two parts:
- The Cup: A rounded, bowl-shaped price correction followed by a gradual recovery.
- The Handle: A short-term pullback or consolidation that occurs after the cup is formed.
The pattern is confirmed when the price breaks above the resistance level, also known as the breakout point, with strong trading volume. This breakout indicates that buyers have regained control and the uptrend is likely to continue.
Structure of the Cup and Handle Pattern
The pattern has three main components.
1. The Cup
- Forms after an uptrend.
- The price gradually declines, creating a rounded bottom.
- The price then slowly recovers to the previous resistance level.
- The rounded shape reflects a healthy correction rather than panic selling.
2. The Handle
- Forms after the cup is completed.
- Appears as a small downward or sideways price movement.
- Represents temporary profit booking before the next upward move.
- Usually remains above the midpoint of the cup.
3. Breakout
The pattern is confirmed when the price closes above the resistance level with increased trading volume.
How Does the Cup and Handle Pattern Form?
The pattern develops in several stages.
Stage 1: Existing Uptrend
The market is already moving upward, showing strong buying momentum.
Stage 2: Formation of the Cup
Traders begin taking profits, causing a gradual price decline. Instead of falling sharply, the price creates a smooth, rounded bottom before recovering to the previous high.
Stage 3: Formation of the Handle
After reaching resistance, the market experiences a small pullback or sideways consolidation. This handle allows weak holders to exit while stronger buyers prepare for the next move.
Stage 4: Breakout
Buyers push the price above the resistance level with strong volume, confirming the pattern and signaling a continuation of the uptrend.
Psychology Behind the Cup and Handle Pattern
The Cup and Handle Pattern reflects changing market sentiment.
Initially, buyers drive the price higher. Profit booking then causes a gradual decline, creating the left side of the cup.
As the price reaches attractive levels, new buyers enter the market and slowly push it higher, forming the right side of the cup.
Near the previous high, some traders take profits again, creating the handle. This temporary pause helps remove short-term selling pressure.
Once buyers overcome the resistance level, confidence increases and additional buying often leads to a strong upward move.
How to Identify a Cup and Handle Pattern
Use the following checklist:
- An existing uptrend is present.
- The cup has a smooth, rounded bottom.
- The handle forms after the cup.
- The handle is relatively small compared to the cup.
- Trading volume generally decreases during the handle.
- Volume increases significantly during the breakout.
The more symmetrical the cup and the cleaner the handle, the more reliable the pattern.
How to Trade the Cup and Handle Pattern
Step 1: Wait for Confirmation
Do not buy before the breakout. Wait until the price closes above the resistance level.
Step 2: Enter the Trade
Many traders enter:
- Immediately after the breakout.
- After a successful retest of the breakout level as new support.
Step 3: Place a Stop Loss
A stop loss is commonly placed:
- Below the lowest point of the handle.
- Below the breakout level after a successful retest.
Step 4: Set a Profit Target
A common method is to measure the depth of the cup and project that distance upward from the breakout point.
Additional target methods include:
- Previous resistance levels.
- Fibonacci extension levels.
- A trailing stop-loss to capture larger trends.
Example of a Cup and Handle Pattern
Suppose a stock rises from ₹500 to ₹700.
- Profit booking causes the price to fall gradually to ₹620, forming the bottom of the cup.
- Buyers slowly push the price back to ₹700.
- The stock then declines slightly to ₹680, creating the handle.
- Strong buying pushes the price above ₹700 with increased volume.
This breakout confirms the Cup and Handle Pattern and signals the continuation of the bullish trend.
Best Indicators to Use with the Cup and Handle Pattern
Combining the pattern with technical indicators improves reliability.
1. Volume
A breakout supported by high trading volume provides stronger confirmation.
2. Relative Strength Index (RSI)
An RSI above 50 and rising often supports bullish momentum.
3. Moving Averages
A price trading above key moving averages strengthens the setup.
4. MACD
A bullish MACD crossover confirms improving momentum.
5. Support and Resistance
The breakout above a well-established resistance level increases confidence in the pattern.
Advantages of the Cup and Handle Pattern
- Strong bullish continuation signal.
- Easy to identify after practice.
- Suitable for beginners.
- Works across stocks, forex, commodities, cryptocurrencies, and indices.
- Offers clear entry, stop-loss, and target levels.
- Can be combined with technical indicators for better accuracy.
Limitations of the Cup and Handle Pattern
Like every chart pattern, it has limitations.
These include:
- False breakouts can occur.
- The pattern may take weeks or months to form.
- Low trading volume weakens the breakout.
- News events can invalidate the setup.
- Poorly formed cups or handles reduce reliability.
Always wait for confirmation before entering a trade.
Common Mistakes Beginners Make
Many new traders make similar mistakes.
Common mistakes include:
- Buying before the breakout.
- Ignoring trading volume.
- Mistaking a sharp V-shaped recovery for a proper cup.
- Trading without a stop loss.
- Ignoring the overall market trend.
- Entering trades without additional confirmation.
Avoiding these mistakes can improve trading results.
Risk Management Tips
Even reliable patterns can fail, making risk management essential.
Follow these guidelines:
- Never risk more than 1–2% of your trading capital on a single trade.
- Always place a stop loss.
- Aim for a minimum risk-to-reward ratio of 1:2.
- Avoid emotional trading decisions.
- Stick to your trading plan.
Consistent risk management is the key to long-term success.
Is the Cup and Handle Pattern Reliable?
The Cup and Handle Pattern is considered one of the most reliable bullish continuation patterns because it reflects healthy profit booking followed by renewed buying interest.
Its reliability improves when:
- The breakout occurs with strong trading volume.
- The handle remains relatively shallow.
- The pattern forms during an existing uptrend.
- Technical indicators such as RSI, MACD, and Moving Averages support the breakout.
Although no trading pattern guarantees profits, combining the Cup and Handle Pattern with sound technical analysis and disciplined risk management can significantly improve trading performance.
Conclusion
The Cup and Handle Pattern is a powerful bullish continuation chart pattern that helps traders identify opportunities to join an existing uptrend. Its rounded cup, small handle, and breakout confirmation make it one of the most trusted patterns in technical analysis.
For the best results, wait for a confirmed breakout, monitor trading volume, use supporting indicators, and always apply proper risk management. With regular practice and discipline, the Cup and Handle Pattern can become a valuable part of your trading strategy.
Frequently Asked Questions (FAQs)
1. What is a Cup and Handle Pattern?
A Cup and Handle Pattern is a bullish continuation chart pattern that signals the potential continuation of an existing uptrend after a period of consolidation.
2. Is the Cup and Handle a candlestick pattern?
No. It is a chart pattern that develops over multiple candles and price swings.
3. How do I confirm a Cup and Handle Pattern?
The pattern is confirmed when the price closes above the resistance level with increased trading volume.
4. Which timeframe is best?
The pattern works on all timeframes, but daily and weekly charts generally provide more reliable signals.
5. Can beginners trade this pattern?
Yes. It is suitable for beginners because it has a clear structure and well-defined entry, stop-loss, and target levels.
6. Which indicators work best?
Volume, RSI, MACD, Moving Averages, and Support & Resistance are commonly used to confirm the breakout.
7. What is the biggest mistake traders make?
The biggest mistake is buying before the breakout instead of waiting for proper confirmation with strong trading volume.