
The Double Bottom Pattern is one of the most reliable bullish reversal chart patterns used in technical analysis. It helps traders identify when a downtrend may be coming to an end and a new uptrend could begin. Because of its distinctive “W” shape, the Double Bottom Pattern is easy to recognize and is widely used by traders in the stock market, forex, commodities, cryptocurrencies, and indices.
While many beginners confuse it with a candlestick pattern, the Double Bottom is actually a chart pattern formed by multiple price movements over time. When confirmed correctly, it can provide excellent buying opportunities with clearly defined entry, stop-loss, and profit target levels.
In this guide, you’ll learn everything about the Double Bottom Pattern, including its formation, market psychology, trading strategy, advantages, limitations, and common mistakes to avoid.
What Is a Double Bottom Pattern?
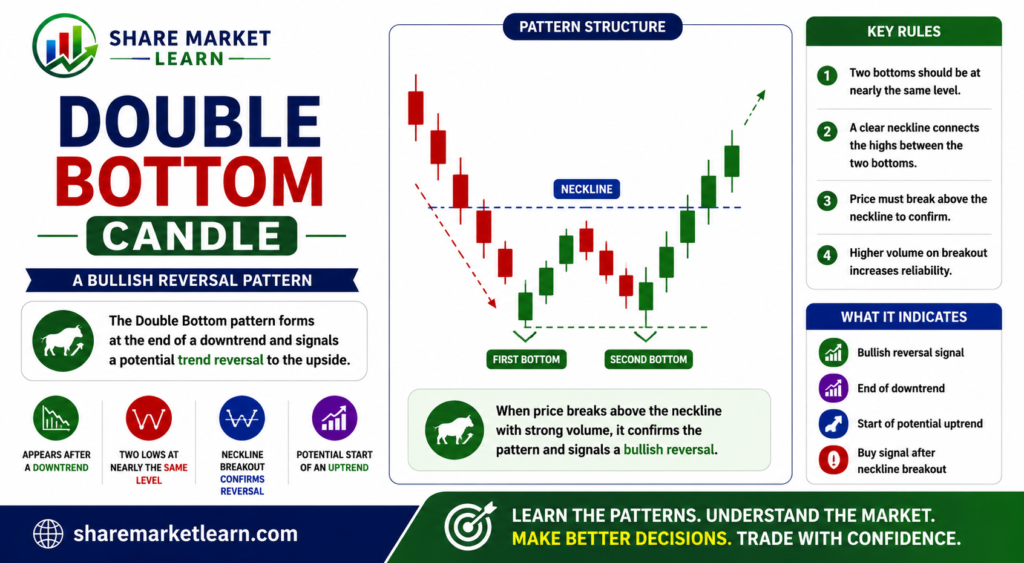
A Double Bottom Pattern is a bullish reversal pattern that forms after a prolonged downtrend. It consists of two consecutive lows at approximately the same price level, separated by a temporary upward price movement.
The pattern resembles the letter “W” and indicates that sellers have attempted twice to push prices lower but failed. This failure suggests that buyers are gradually gaining control, increasing the probability of an upward reversal.
The pattern is only considered complete when the price breaks above the resistance level formed between the two bottoms, commonly known as the neckline.
Structure of a Double Bottom Pattern
The Double Bottom Pattern consists of three main parts:
First Bottom
- Forms after a strong downtrend.
- Heavy selling pushes the price to a new low.
- Buyers enter the market and cause a temporary rebound.
Neckline
- The price rises from the first bottom and reaches a resistance level.
- This resistance becomes the neckline of the pattern.
Second Bottom
- Sellers attempt another decline.
- The price falls near the first bottom but fails to break significantly lower.
- Buyers regain control and push the price upward.
The pattern is confirmed once the price closes above the neckline.
How Does a Double Bottom Pattern Form?
The pattern develops in several stages.
Stage 1: Strong Downtrend
The market has been falling for an extended period as sellers remain in control.
Stage 2: First Bottom
Selling pressure begins to weaken, allowing buyers to create a temporary recovery.
Stage 3: Pullback
The price rises toward resistance but lacks enough momentum to continue upward.
Stage 4: Second Bottom
The market retests the previous low. Sellers fail to push the price significantly lower, showing that bearish momentum is fading.
Stage 5: Breakout
Buyers gain confidence and push the price above the neckline, confirming a bullish reversal.
Psychology Behind the Double Bottom Pattern
Understanding the psychology behind the pattern makes it easier to trust the signal.
During the first decline, sellers dominate the market and push prices sharply lower. Buyers eventually step in, creating a temporary bounce.
Sellers then make another attempt to continue the downtrend. However, this time they fail to break below the previous low. This failure indicates that selling pressure is weakening.
As buyers recognize this shift, they begin purchasing more aggressively. When the neckline is broken, many traders interpret it as confirmation that a new uptrend has started.
This shift in market sentiment is what makes the Double Bottom Pattern such a powerful bullish reversal signal.
How to Identify a Double Bottom Pattern
Use this checklist when looking for the pattern:
- A clear downtrend exists before the pattern forms.
- Two lows occur at approximately the same price level.
- A temporary upward move separates the two bottoms.
- The neckline acts as resistance.
- The breakout above the neckline occurs with increased trading volume.
- The second bottom does not fall significantly below the first.
The more closely these conditions are met, the stronger the pattern becomes.
How to Trade the Double Bottom Pattern
Step 1: Wait for Confirmation
Avoid entering a trade before the breakout. The pattern is confirmed only after the price closes above the neckline.
Step 2: Enter the Trade
Many traders buy:
- Immediately after the neckline breakout.
- Or after a successful retest of the neckline as new support.
Step 3: Place a Stop Loss
A stop loss is commonly placed:
- Below the second bottom.
- Below the neckline after a successful retest.
Step 4: Set a Profit Target
Profit targets can be estimated by measuring the distance between the neckline and the bottoms, then projecting that distance above the breakout point.
You can also use:
- Major resistance levels.
- A minimum risk-to-reward ratio of 1:2.
- A trailing stop-loss.
Example of a Double Bottom Pattern
Imagine a stock falls from ₹1,000 to ₹800.
- The first bottom forms near ₹800.
- Buyers push the price up to ₹860, creating the neckline.
- Sellers push the price back to ₹805, forming the second bottom.
- Buyers return and push the price above ₹860 with strong trading volume.
This breakout confirms the Double Bottom Pattern and signals a potential bullish trend.
Best Indicators to Use with the Double Bottom Pattern
Using technical indicators alongside the pattern improves reliability.
1. Volume
Higher trading volume during the breakout strengthens the bullish signal.
2. Relative Strength Index (RSI)
An RSI reading below 30 before the breakout suggests the market may be oversold and ready for a reversal.
3. Moving Averages
A breakout above important moving averages provides additional confirmation.
4. MACD
A bullish MACD crossover often supports the breakout.
5. Support and Resistance
The pattern becomes stronger when it forms near a long-term support zone.
Advantages of the Double Bottom Pattern
- Easy to recognize.
- Strong bullish reversal signal.
- Suitable for beginners.
- Works in stocks, forex, commodities, cryptocurrencies, and indices.
- Provides clear entry, stop-loss, and target levels.
- Can be combined with multiple technical indicators.
Limitations of the Double Bottom Pattern
Like any trading pattern, it has limitations.
These include:
- False breakouts can occur.
- Confirmation is essential.
- Low trading volume reduces reliability.
- Market news can invalidate the setup.
- Patience is required while the pattern develops.
Common Mistakes Beginners Make
Many new traders make these mistakes:
- Buying before the neckline breakout.
- Ignoring trading volume.
- Misidentifying random price movements as a Double Bottom.
- Skipping stop-loss orders.
- Ignoring the overall market trend.
- Trading without confirmation from other indicators.
Avoiding these mistakes improves trading consistency.
Risk Management Tips
Good risk management is essential.
Follow these guidelines:
- Never risk more than 1–2% of your capital on a single trade.
- Always use a stop loss.
- Aim for a risk-to-reward ratio of at least 1:2.
- Avoid emotional decision-making.
- Follow your trading plan consistently.
Protecting your capital is just as important as finding profitable trades.
Is the Double Bottom Pattern Reliable?
The Double Bottom Pattern is considered one of the most reliable bullish reversal patterns because it clearly demonstrates that sellers failed twice to push prices lower.
Its reliability improves when:
- The breakout occurs with high trading volume.
- The neckline is decisively broken.
- The pattern forms after a prolonged downtrend.
- Technical indicators such as RSI, MACD, and Moving Averages confirm the signal.
Although no pattern guarantees success, combining the Double Bottom with proper technical analysis and disciplined risk management can significantly improve trading results.
Conclusion
The Double Bottom Pattern is an excellent bullish reversal chart pattern that helps traders identify potential buying opportunities after a downtrend. Its easy-to-recognize “W” shape and clear confirmation rules make it suitable for both beginners and experienced traders.
However, successful trading requires patience and confirmation. Always wait for the neckline breakout, combine the pattern with technical indicators, monitor trading volume, and apply sound risk management.
By practicing regularly and following a disciplined trading strategy, the Double Bottom Pattern can become a valuable tool in your technical analysis toolkit.
Frequently Asked Questions (FAQs)
1. What is a Double Bottom Pattern?
A Double Bottom Pattern is a bullish reversal chart pattern that forms after a downtrend and signals a potential upward price reversal.
2. Is the Double Bottom a candlestick pattern?
No. It is a chart pattern, not a single candlestick pattern. It develops over multiple candles and price swings.
3. How do I confirm a Double Bottom Pattern?
The pattern is confirmed when the price closes above the neckline with strong trading volume.
4. Which timeframe works best?
The Double Bottom works on all timeframes, but daily and 4-hour charts generally provide more reliable signals.
5. Can beginners trade the Double Bottom Pattern?
Yes. It is one of the easiest chart patterns to recognize and is suitable for beginners when confirmation and risk management are used.
6. Which indicators work best with the Double Bottom?
Volume, RSI, MACD, Moving Averages, and Support & Resistance are excellent confirmation tools.
7. What is the biggest mistake traders make?
The most common mistake is entering the trade before the neckline breakout instead of waiting for confirmation.