
The Spinning Top Candle is one of the most common candlestick patterns in technical analysis. It represents market indecision, where neither buyers nor sellers are able to gain complete control during a trading session. Although it may appear simple, the Spinning Top Candle can provide valuable insights into potential trend reversals or continuation when used with other technical analysis tools.
Whether you are trading stocks, forex, commodities, or cryptocurrencies, understanding the Spinning Top Candle can help you identify periods of uncertainty and prepare for possible market movements.
In this guide, you’ll learn what the Spinning Top Candle is, how it forms, the psychology behind it, how to trade it, its advantages and limitations, and the common mistakes traders should avoid.
What Is a Spinning Top Candle?
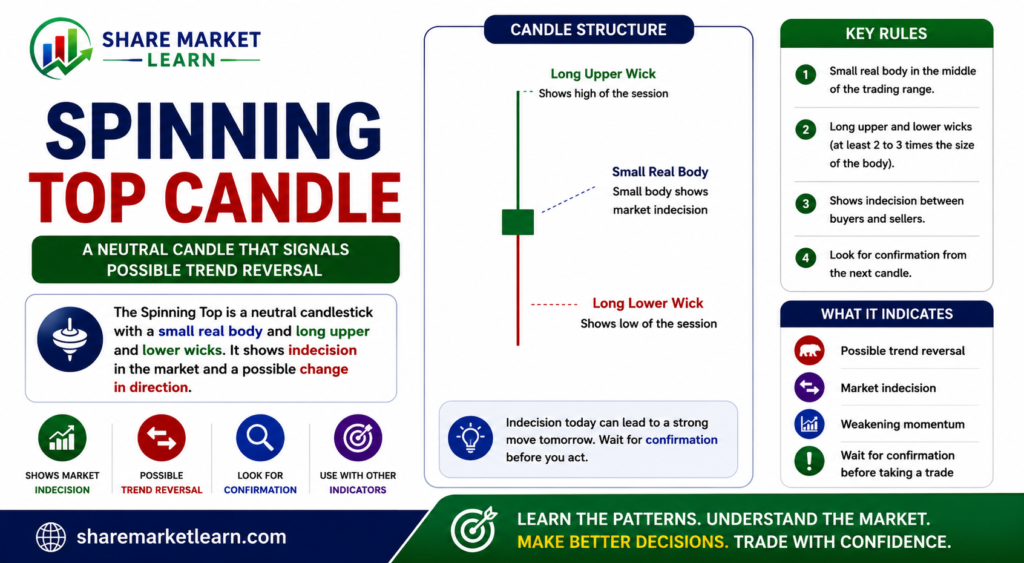
A Spinning Top Candle is a single candlestick pattern with a small real body and long upper and lower shadows. The small body shows that the opening and closing prices are close to each other, while the long wicks indicate that both buyers and sellers were active during the trading session.
Because neither side managed to maintain control by the close, the candle reflects indecision in the market.
A Spinning Top Candle can appear during both uptrends and downtrends. Its significance depends on the overall market trend and where it forms on the chart.
Structure of a Spinning Top Candle
A typical Spinning Top Candle has the following characteristics:
- A small real body.
- Long upper shadow.
- Long lower shadow.
- Opening and closing prices are close together.
- Upper and lower shadows are usually longer than the body.
The candle body may be bullish or bearish, but its color is generally less important than its overall shape.
How Does a Spinning Top Candle Form?
The pattern develops through continuous buying and selling pressure during the trading session.
Stage 1: Market Opens
The market opens and begins moving in one direction.
Stage 2: Buyers and Sellers Compete
Throughout the session, buyers push prices higher while sellers push them lower. Both sides are active, causing large price swings.
Stage 3: Market Closes
By the end of the session, the price closes near its opening level. Although there was significant movement during the day, neither buyers nor sellers gained a clear advantage.
This creates the small body with long upper and lower shadows that defines a Spinning Top Candle.
Psychology Behind the Spinning Top Candle
Understanding the market psychology behind the Spinning Top is essential for interpreting its signal.
During the trading session, buyers attempt to drive prices higher while sellers push prices lower. This tug-of-war creates long shadows on both sides of the candle.
Eventually, the market closes close to where it opened, showing that neither side has won the battle.
This indecision often signals that the current trend is losing momentum. However, the pattern alone does not confirm a reversal. Traders should always wait for confirmation from the following candle or additional technical indicators.
Types of Spinning Top Candles
There are two common variations of the pattern.
Bullish Spinning Top
A bullish Spinning Top has a close slightly above its opening price. It may indicate buying interest, especially after a downtrend.
Bearish Spinning Top
A bearish Spinning Top closes slightly below its opening price. It may suggest weakening buying pressure after an uptrend.
Despite these differences, both variations primarily represent market indecision.
How to Identify a Spinning Top Candle
Use the following checklist:
- Small real body.
- Long upper shadow.
- Long lower shadow.
- Opening and closing prices are close together.
- Appears after a noticeable uptrend or downtrend.
- Higher trading volume strengthens the signal.
The clearer these characteristics are, the more meaningful the pattern becomes.
How to Trade the Spinning Top Candle
Step 1: Identify the Trend
Determine whether the Spinning Top appears after an uptrend or a downtrend.
The market context helps determine whether the pattern may signal a reversal or continuation.
Step 2: Wait for Confirmation
Never trade solely based on the Spinning Top.
Wait for the next candle:
- A bearish confirmation after an uptrend may indicate a reversal.
- A bullish confirmation after a downtrend may signal a potential upward move.
Step 3: Enter the Trade
Enter only after confirmation.
For bearish confirmation:
- Sell below the low of the confirmation candle.
For bullish confirmation:
- Buy above the high of the confirmation candle.
Step 4: Place a Stop Loss
Place the stop loss:
- Below the low for bullish trades.
- Above the high for bearish trades.
Step 5: Set a Profit Target
Use:
- Nearby support and resistance levels.
- A minimum risk-to-reward ratio of 1:2.
- A trailing stop-loss for larger market moves.
Example of a Spinning Top Candle
Imagine a stock is trading around ₹1,200 after a strong uptrend.
- The stock opens at ₹1,205.
- Buyers push the price to ₹1,235.
- Sellers drive the price down to ₹1,185.
- The stock finally closes at ₹1,208.
Although the market experienced significant movement during the day, it closed near its opening price. This creates a classic Spinning Top Candle, indicating market indecision.
If the next candle is strongly bearish, it may confirm the start of a downward reversal.
Best Indicators to Use with the Spinning Top Candle
The Spinning Top becomes more reliable when combined with technical indicators.
1. Volume
Higher trading volume strengthens the importance of the pattern.
2. Relative Strength Index (RSI)
An overbought RSI after an uptrend or an oversold RSI after a downtrend can improve the quality of trading signals.
3. Moving Averages
Major moving averages can help confirm the direction of the next trend.
4. Support and Resistance
Spinning Top Candles forming near important support or resistance levels often provide stronger signals.
5. MACD
A MACD crossover following the pattern offers additional confirmation.
Advantages of the Spinning Top Candle
- Easy to identify.
- Reflects market indecision clearly.
- Suitable for all financial markets.
- Works on multiple timeframes.
- Useful for identifying possible trend reversals.
- Can improve decision-making when combined with technical indicators.
Limitations of the Spinning Top Candle
Despite its usefulness, the pattern has limitations.
These include:
- It does not confirm market direction on its own.
- False signals may occur during sideways markets.
- Confirmation is always required.
- News events can quickly invalidate the pattern.
- It should not be used without proper risk management.
Understanding these limitations helps traders avoid unnecessary losses.
Common Mistakes Beginners Make
Many traders make similar mistakes when using the Spinning Top.
Common mistakes include:
- Trading without confirmation.
- Ignoring the overall market trend.
- Not checking trading volume.
- Skipping stop-loss orders.
- Depending only on candlestick patterns.
- Ignoring support and resistance levels.
Avoiding these mistakes can improve trading consistency.
Risk Management Tips
Every successful trader understands the importance of protecting capital.
Follow these basic rules:
- Never risk more than 1–2% of your trading capital on one trade.
- Always place a stop loss.
- Aim for a minimum risk-to-reward ratio of 1:2.
- Stay disciplined and avoid emotional trading.
- Follow your trading strategy consistently.
Good risk management is essential for long-term profitability.
Is the Spinning Top Candle Reliable?
The Spinning Top Candle is a valuable pattern because it highlights uncertainty in the market. However, it does not predict market direction by itself.
Its reliability improves when:
- It appears after a strong trend.
- It forms near major support or resistance.
- Trading volume increases.
- Other technical indicators confirm the signal.
Using multiple forms of analysis together provides better trading opportunities.
Conclusion
The Spinning Top Candle is an important candlestick pattern that signals market indecision and potential changes in momentum. Although it does not guarantee a reversal, it warns traders that the current trend may be weakening.
The best way to use the Spinning Top is alongside technical indicators, support and resistance analysis, and proper risk management. By waiting for confirmation and following a disciplined trading plan, traders can use this pattern more effectively and make better-informed decisions.
Frequently Asked Questions (FAQs)
1. What is a Spinning Top Candle?
A Spinning Top Candle is a single candlestick with a small body and long upper and lower shadows, indicating market indecision.
2. Is the Spinning Top suitable for beginners?
Yes. It is easy to identify and helps beginners understand market psychology and trend strength.
3. Does a Spinning Top always indicate a trend reversal?
No. It signals indecision, not a guaranteed reversal. Confirmation from the next candle is essential.
4. Which timeframe is best for the Spinning Top?
The pattern works on all timeframes, but daily and 4-hour charts generally provide more reliable signals.
5. Can intraday traders use the Spinning Top?
Yes. Intraday traders use it on lower timeframes, but confirmation and risk management remain essential.
6. Which indicators work best with the Spinning Top?
Volume, RSI, MACD, Moving Averages, and Support & Resistance are excellent tools for confirming the pattern.
7. What is the biggest mistake traders make with the Spinning Top?
The most common mistake is trading the pattern without waiting for confirmation from the next candle or ignoring the overall market trend.