
The Bearish Pin Bar Candle is one of the most popular and reliable candlestick patterns in price action trading. It signals that buyers attempted to push prices higher but were rejected by strong selling pressure. As a result, the market closed much lower than its highest point, indicating that sellers have gained control.
Traders use the Bearish Pin Bar to identify potential market reversals, especially after an uptrend or near key resistance levels. While the pattern is simple to recognize, using it correctly requires understanding the market context and confirming the signal with other technical analysis tools.
In this guide, you’ll learn what a Bearish Pin Bar Candle is, how it forms, the psychology behind it, how to trade it, its advantages and limitations, and common mistakes to avoid.
What Is a Bearish Pin Bar Candle?
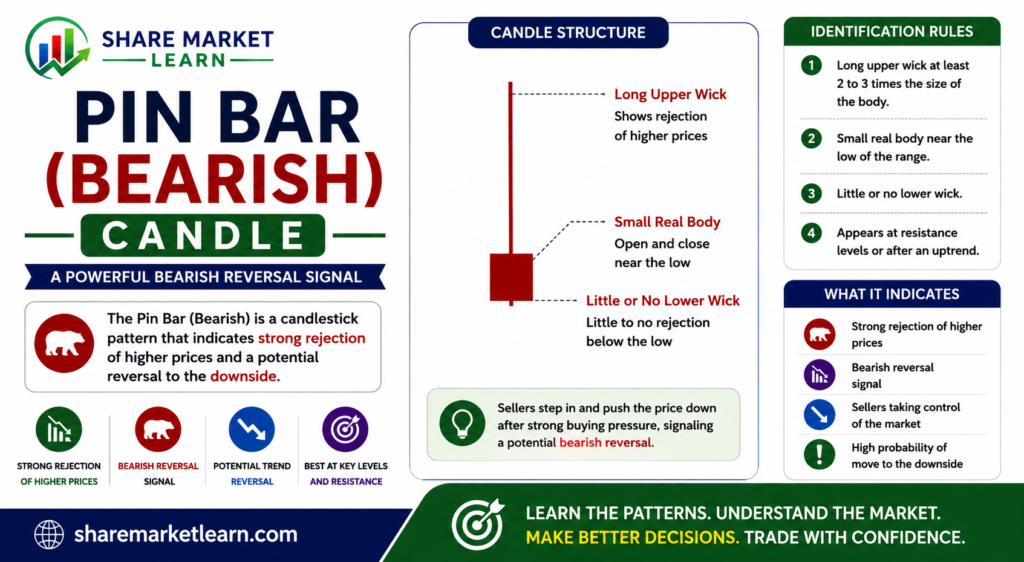
A Bearish Pin Bar Candle is a single-candlestick bearish reversal pattern characterized by a long upper shadow (wick), a small real body near the bottom of the candle, and a very short or no lower shadow.
The long upper wick shows that buyers initially pushed the price significantly higher during the trading session. However, sellers stepped in aggressively, forcing the price back down before the candle closed. This rejection of higher prices suggests that bearish momentum may be increasing.
The Bearish Pin Bar is most effective when it appears after a strong uptrend or at a significant resistance level.
Structure of a Bearish Pin Bar Candle
The Bearish Pin Bar has three key characteristics:
- A small real body near the lower end of the candle.
- A long upper shadow that is at least twice the size of the body.
- A very small or no lower shadow.
The longer the upper wick, the stronger the rejection of higher prices and the more significant the bearish signal.
How Does the Bearish Pin Bar Form?
The formation takes place in three stages:
Stage 1: Buyers Push Prices Higher
The market opens, and buyers continue the existing uptrend by driving prices upward.
Stage 2: Sellers Enter the Market
As prices rise, sellers begin entering the market aggressively. Selling pressure increases and starts reversing the upward move.
Stage 3: Sellers Take Control
By the close of the session, sellers have pushed the price back down near the opening level, creating a long upper wick and a small body near the bottom of the candle.
This price rejection forms the Bearish Pin Bar.
Psychology Behind the Bearish Pin Bar Candle
Understanding the psychology behind the pattern helps traders interpret its significance.
Initially, buyers appear to have complete control of the market and push prices to new highs. However, these higher prices attract strong selling interest. Sellers overwhelm buyers, causing the price to fall sharply before the session ends.
This shift in momentum indicates that buyers may be losing confidence while sellers are becoming more aggressive. As a result, the Bearish Pin Bar often marks the beginning of a bearish reversal, especially when supported by other technical signals.
How to Identify a Bearish Pin Bar Candle
Use this checklist to identify the pattern:
- The market is in an uptrend or approaching a strong resistance level.
- The candle has a long upper shadow.
- The real body is small and positioned near the bottom of the candle.
- The lower shadow is very small or absent.
- The upper wick is at least twice the length of the body.
- Trading volume is higher than average for stronger confirmation.
The clearer these characteristics are, the more reliable the pattern becomes.
How to Trade the Bearish Pin Bar Candle
Step 1: Wait for Confirmation
Do not enter a trade immediately after the Bearish Pin Bar forms. Wait for the next candle to close below the low of the Pin Bar to confirm that sellers remain in control.
Step 2: Enter the Trade
Many traders enter a sell trade:
- Below the low of the Bearish Pin Bar.
- After the confirmation candle closes below the pattern.
Step 3: Place a Stop Loss
Protect your capital by placing the stop loss:
- Above the high of the Pin Bar.
- Above the nearest resistance level if appropriate.
Step 4: Set a Profit Target
Profit targets can be based on:
- Previous support levels.
- A minimum risk-to-reward ratio of 1:2.
- A trailing stop-loss to capture larger downward moves.
Example of a Bearish Pin Bar Candle
Imagine a stock has been rising steadily and is trading near ₹2,500.
- The stock opens at ₹2,490.
- Buyers push the price up to ₹2,560 during the session.
- Sellers step in aggressively and drive the price down.
- The stock closes at ₹2,495.
The resulting candle has a long upper wick and a small body near the bottom, forming a Bearish Pin Bar that signals potential bearish momentum.
Best Indicators to Use with the Bearish Pin Bar
Although the Bearish Pin Bar is a strong price action signal, combining it with technical indicators improves reliability.
1. Volume
High trading volume strengthens the rejection signal.
2. Relative Strength Index (RSI)
An RSI reading above 70 suggests the market may be overbought, increasing the likelihood of a reversal.
3. Moving Averages
A Bearish Pin Bar forming near a major moving average can provide stronger confirmation.
4. Support and Resistance
The pattern becomes more effective when it appears at an important resistance zone.
5. MACD
A bearish MACD crossover following the pattern can confirm increasing downward momentum.
Advantages of the Bearish Pin Bar Candle
- Easy to recognize.
- Indicates strong rejection of higher prices.
- Popular among price action traders.
- Suitable for stocks, forex, commodities, and cryptocurrencies.
- Works across multiple timeframes.
- Provides clear entry and stop-loss levels.
Limitations of the Bearish Pin Bar Candle
Despite its popularity, the pattern has some limitations:
- False signals can occur in sideways markets.
- Less reliable without confirmation.
- Market news can invalidate the signal.
- Should not be used as a standalone trading strategy.
- Requires proper risk management.
Understanding these limitations helps traders avoid unnecessary losses.
Common Mistakes Beginners Make
Many traders make avoidable mistakes when trading the Bearish Pin Bar.
Common mistakes include:
- Entering before confirmation.
- Ignoring the overall market trend.
- Trading without a stop loss.
- Overlooking trading volume.
- Ignoring support and resistance levels.
- Depending only on the candlestick pattern.
Avoiding these errors can significantly improve trading performance.
Risk Management Tips
Successful trading depends on managing risk effectively.
Follow these simple rules:
- Never risk more than 1–2% of your trading capital on a single trade.
- Always place a stop loss.
- Maintain a minimum risk-to-reward ratio of 1:2.
- Avoid emotional trading decisions.
- Stick to your trading plan.
Good risk management protects your capital and supports long-term success.
Is the Bearish Pin Bar Candle Reliable?
The Bearish Pin Bar Candle is considered one of the most reliable price action reversal patterns because it clearly shows rejection of higher prices. However, no candlestick pattern guarantees a successful trade.
Its reliability improves when:
- It appears after a strong uptrend.
- It forms near an important resistance level.
- Trading volume increases.
- Other technical indicators such as RSI, MACD, or Moving Averages confirm the signal.
Combining multiple technical analysis tools can improve the probability of successful trades.
Conclusion
The Bearish Pin Bar Candle is a powerful bearish reversal pattern that reflects a strong rejection of higher prices and increasing selling pressure. Its simple structure and clear market message make it a favorite among both beginner and experienced traders.
However, successful trading involves more than recognizing candlestick patterns. Always combine the Bearish Pin Bar with technical indicators, support and resistance analysis, and disciplined risk management. With practice and patience, this pattern can become an effective part of your trading strategy.
Frequently Asked Questions (FAQs)
1. What is a Bearish Pin Bar Candle?
A Bearish Pin Bar Candle is a single-candlestick bearish reversal pattern with a long upper wick and a small body near the bottom, indicating rejection of higher prices.
2. Is the Bearish Pin Bar suitable for beginners?
Yes. It is one of the easiest price action patterns to identify and is suitable for beginners when used with confirmation.
3. Does a Bearish Pin Bar always indicate a market reversal?
No. It increases the probability of a reversal but should always be confirmed with the next candle, trading volume, and technical indicators.
4. Which timeframe is best for the Bearish Pin Bar?
The pattern works on all timeframes, but daily and 4-hour charts generally provide more reliable signals.
5. Can intraday traders use the Bearish Pin Bar?
Yes. Intraday traders can use the pattern on lower timeframes with proper confirmation and risk management.
6. Which indicators work best with the Bearish Pin Bar?
Volume, RSI, MACD, Moving Averages, and Support & Resistance are commonly used to confirm the pattern.
7. What is the biggest mistake traders make when using the Bearish Pin Bar?
The most common mistake is entering a trade without waiting for confirmation or failing to place a proper stop loss.