
The Gravestone Doji Candle is one of the most well-known candlestick patterns in technical analysis. Traders often pay close attention to this pattern because it can signal that a market uptrend may be losing strength and a potential reversal could be approaching.
If you are new to the stock market or candlestick chart analysis, understanding the Gravestone Doji Candle can help you make better trading decisions. In this article, we’ll explain what this pattern means, how it forms, why it is important, and how traders use it in real-world situations.
What Is a Gravestone Doji Candle?
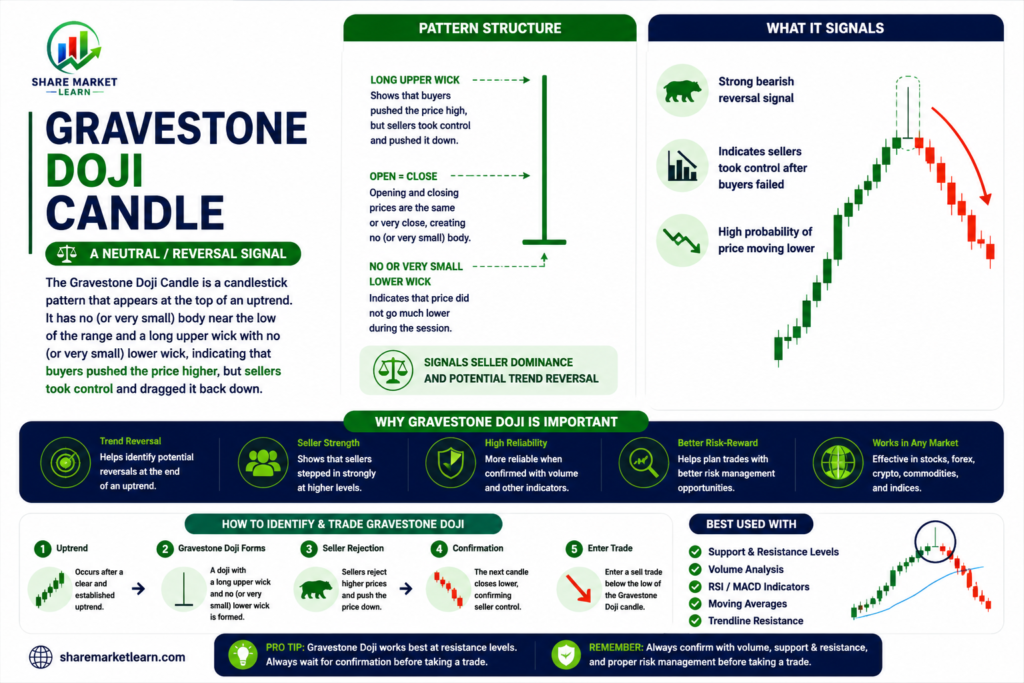
A Gravestone Doji Candle is a bearish reversal candlestick pattern that appears when the opening price, closing price, and low price are nearly the same, while the upper shadow is long.
This formation shows that buyers initially pushed the price significantly higher during the trading session. However, sellers eventually gained control and pushed the price back down to the opening level before the session ended.
As a result, the candle resembles an upside-down “T.”
Key Characteristics of a Gravestone Doji Candle
- Very small or almost nonexistent candle body.
- Long upper shadow.
- Little to no lower shadow.
- Opening and closing prices are nearly equal.
- Commonly appears after an uptrend.
What Does the Gravestone Doji Candle Indicate?
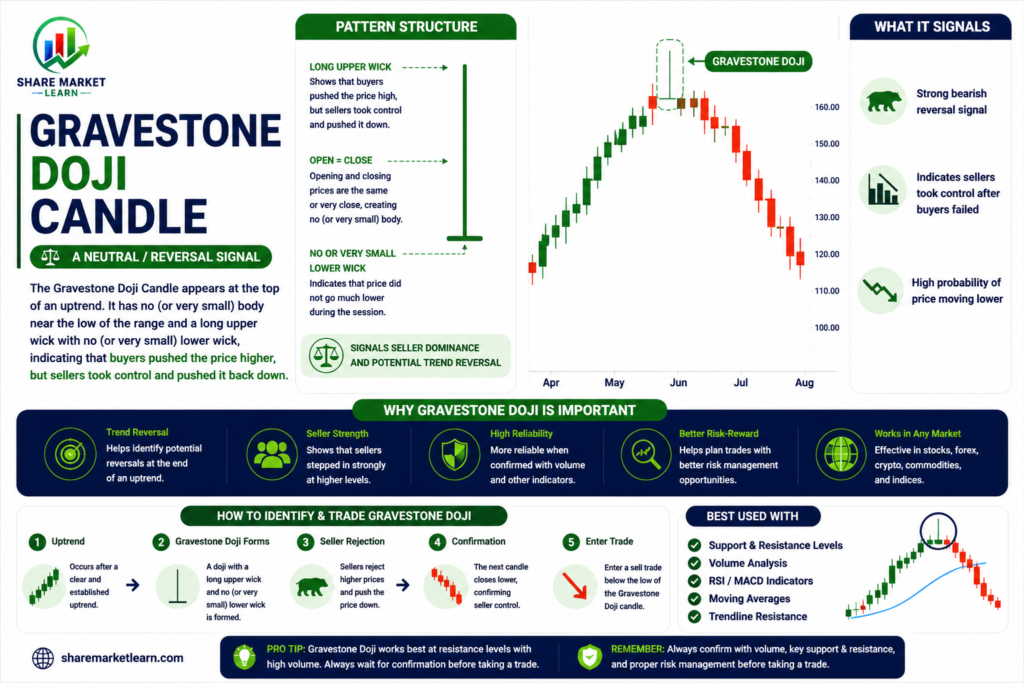
The Gravestone Doji Candle reflects a battle between buyers and sellers.
Here’s what happens during its formation:
- Buyers dominate the market early in the session.
- Prices rise sharply.
- Sellers enter aggressively.
- The gains are erased by the close.
- The market closes near the opening price.
This shift in momentum may indicate that bullish strength is weakening and bearish pressure is increasing.
However, traders should remember that the Gravestone Doji Candle alone does not guarantee a reversal. Confirmation from the following candle or additional indicators is always recommended.
How Does a Gravestone Doji Candle Form?
Understanding the formation process makes it easier to identify the pattern.
Stage 1: Strong Buying Activity
At the beginning of the session, buyers push the price upward, showing confidence in the ongoing uptrend.
Stage 2: Sellers Step In
As prices climb higher, sellers begin taking profits or initiating short positions.
Stage 3: Market Rejection
Selling pressure becomes strong enough to erase the earlier gains.
Stage 4: Close Near the Opening Price
The candle closes very close to where it opened, creating the distinctive Gravestone Doji shape.
This sequence suggests that the market rejected higher prices.
Why Is the Gravestone Doji Candle Important?
The Gravestone Doji Candle is important because it can provide an early warning that a trend reversal may occur.
Benefits of Recognizing This Pattern
- Helps identify potential bearish reversals.
- Assists traders in protecting profits.
- Supports better entry and exit decisions.
- Encourages traders to seek confirmation before acting.
- Improves overall market awareness.
Although useful, it should never be used as a standalone trading signal.
How to Trade Using the Gravestone Doji Candle
Many traders incorporate this pattern into their trading strategies.
Wait for Confirmation
The candle appearing by itself is not enough.
A bearish confirmation candle, such as a strong red candle closing below the Gravestone Doji’s low, strengthens the reversal signal.
Check the Trend
The Gravestone Doji Candle is more reliable when it forms after a noticeable uptrend.
If it appears during sideways movement, its significance may be reduced.
Use Support and Resistance Levels
The pattern becomes stronger when it forms near major resistance zones.
Resistance levels often attract selling activity, increasing the possibility of a reversal.
Combine With Technical Indicators
Traders frequently use additional indicators, including:
- Relative Strength Index (RSI)
- Moving Averages
- MACD
- Volume Analysis
Using multiple tools can improve decision-making.
Example of a Gravestone Doji Candle
Imagine a stock trading at ₹500.
- Opening Price: ₹500
- Buyers push the price to ₹535.
- Sellers enter and drive the price back down.
- Closing Price: ₹501.
The candle ends with a long upper shadow and almost no body.
This indicates that buyers failed to maintain control despite their initial strength.
Many traders would then wait for the next day’s candle before deciding whether to sell, avoid new long positions, or consider a short trade.
Gravestone Doji vs Dragonfly Doji
These two Doji patterns are often confused.
Gravestone Doji
- Long upper shadow.
- Little or no lower shadow.
- Bearish reversal signal.
- Commonly appears after an uptrend.
Dragonfly Doji
- Long lower shadow.
- Little or no upper shadow.
- Bullish reversal signal.
- Commonly appears after a downtrend.
Understanding the difference can help traders interpret market sentiment more accurately.
Limitations of the Gravestone Doji Candle
Like every technical analysis tool, the Gravestone Doji Candle has limitations.
It Does Not Guarantee Reversals
Markets are influenced by many factors. Sometimes the pattern fails, and the uptrend continues.
False Signals Can Occur
In volatile markets, the candle may generate misleading signals.
Confirmation Is Necessary
Professional traders rarely make decisions based on a single candlestick pattern.
Risk Management Is Essential
Always use stop-loss orders and proper position sizing to manage potential losses.
Tips for Beginners
If you’re new to candlestick trading, keep these practical tips in mind:
- Practice identifying the pattern on historical charts.
- Never trade solely based on one candle.
- Use confirmation signals.
- Learn about support and resistance.
- Maintain disciplined risk management.
- Start with smaller positions until you gain experience.
Patience and consistency are often more important than trying to predict every market move.
Conclusion
The Gravestone Doji Candle is a valuable candlestick pattern that signals potential weakness in an existing uptrend. It forms when buyers push prices higher but sellers eventually force the market back near its opening level, creating an upside-down “T” shape.
While the pattern can indicate a possible bearish reversal, it should always be confirmed using additional price action and technical indicators. By combining the Gravestone Doji Candle with sound risk management and broader market analysis, traders can make more informed decisions and improve their understanding of market psychology.
Whether you’re a beginner or an experienced trader, learning how to recognize and interpret the Gravestone Doji Candle can become an important part of your trading education.