
Introduction
The Dragonfly Doji is one of the most popular candlestick patterns used in technical analysis. Traders and investors closely watch this pattern because it can signal a potential reversal in the market trend. Whether you are a beginner or an experienced trader, understanding the Dragonfly Doji can help you make better trading decisions.
Candlestick patterns provide valuable insights into market psychology. The Dragonfly Doji is particularly important because it shows a battle between buyers and sellers, where buyers eventually gain control by the end of the trading session.
In this article, you will learn what a Dragonfly Doji is, how it forms, its significance, advantages, limitations, and trading strategies that can help improve your market analysis.
What is a Dragonfly Doji?
A Dragonfly Doji is a candlestick pattern that forms when the opening price, closing price, and highest price are nearly the same, while the low price is significantly lower during the trading session.
The candle appears in the shape of a “T” because it has:
- A long lower shadow
- Little or no upper shadow
- Open and close prices near the high
This pattern indicates that sellers initially pushed prices lower, but buyers regained control, driving the price back up before the session closed.
The Dragonfly Doji often suggests a possible bullish reversal when it appears after a downtrend.
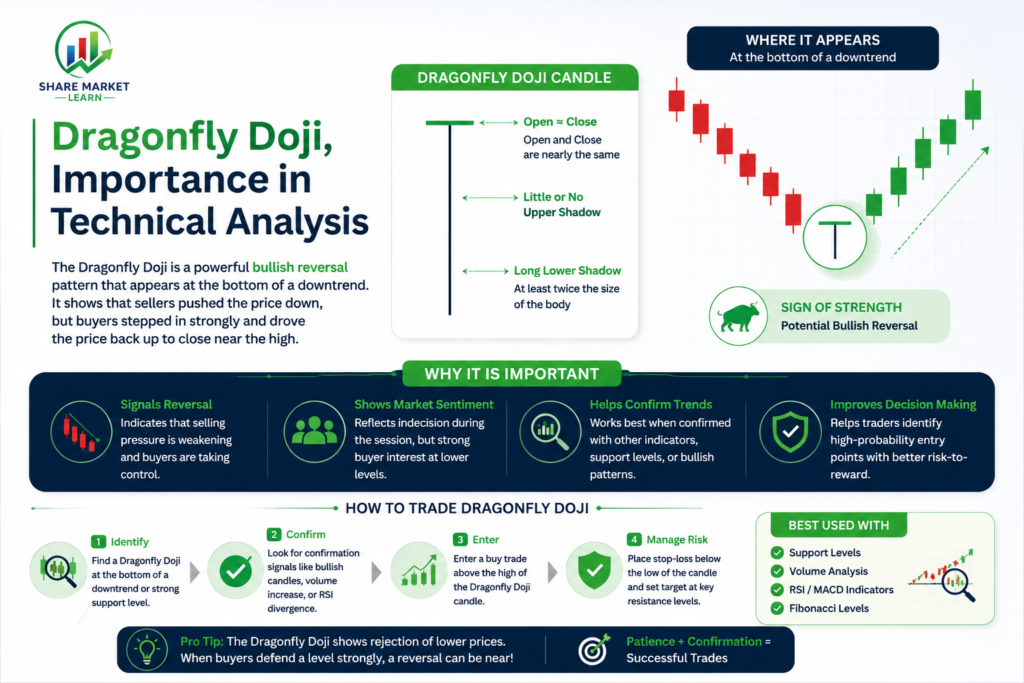
Structure of a Dragonfly Doji
A Dragonfly Doji has three key characteristics:
Long Lower Shadow
The long lower wick shows that sellers dominated the market during a part of the trading session.
No or Very Small Upper Shadow
The lack of an upper shadow indicates that prices closed near the session’s highest point.
Open and Close at Similar Levels
The opening and closing prices remain almost identical, creating the classic Doji appearance.
How Does a Dragonfly Doji Form?
The Dragonfly Doji forms through the following market actions:
- The market opens.
- Sellers enter aggressively and push prices downward.
- Buyers step in and absorb selling pressure.
- Buyers continue purchasing and drive prices back to the opening level.
- The market closes near the high of the day.
This process reflects a shift in market sentiment from bearish to bullish.
Psychology Behind the Dragonfly Doji
Understanding market psychology is essential for successful trading. When a Dragonfly Doji appears, it tells a story:
- Sellers initially have control.
- Prices fall significantly.
- Buyers begin to see value at lower levels.
- Buying pressure increases.
- Buyers erase the entire decline by the close.
This behavior indicates that bearish momentum may be weakening and buyers may be preparing to take control.
Dragonfly Doji in an Uptrend
When a Dragonfly Doji appears during an uptrend, its interpretation becomes slightly different. It may indicate:
- Market indecision
- Profit booking by traders
- Potential trend exhaustion
In such cases, traders should wait for confirmation from the next candle before making decisions. A bearish candle after the Dragonfly Doji may suggest a possible trend reversal.
Dragonfly Doji in a Downtrend
The Dragonfly Doji is most powerful when it appears after a prolonged downtrend. In this situation, it may indicate:
- Sellers are losing strength.
- Buyers are entering the market.
- A bullish reversal could occur.
Many traders consider this one of the strongest reversal signals when combined with other technical indicators.
Importance of Confirmation
One common mistake traders make is entering a trade immediately after spotting a Dragonfly Doji. A single candlestick should not be used as a standalone trading signal.
Confirmation is important because:
- False signals can occur.
- Market conditions may change quickly.
- Additional evidence increases trading accuracy.
A bullish confirmation candle typically closes above the Dragonfly Doji’s high.
Dragonfly Doji Trading Strategy
Bullish Reversal Strategy
Step 1: Identify a Downtrend
Look for a stock, index, or asset that has been declining for several sessions.
Step 2: Spot the Dragonfly Doji
Wait for the Dragonfly Doji to form near a support level.
Step 3: Wait for Confirmation
The next candle should close above the Dragonfly Doji’s high.
Step 4: Enter the Trade
Consider entering a long position after confirmation.
Step 5: Place Stop Loss
Place the stop loss below the low of the Dragonfly Doji.
Step 6: Set Profit Targets
Use resistance levels or a favorable risk-reward ratio for profit booking.
Using Dragonfly Doji with Support and Resistance
Support and resistance levels significantly improve the reliability of the Dragonfly Doji.
At Support Levels
A Dragonfly Doji appearing at support often indicates strong buying interest.
Near Resistance Levels
If the pattern appears near resistance during an uptrend, traders should be cautious because the signal may not remain bullish.
Combining Dragonfly Doji with Technical Indicators
Professional traders rarely rely on a single pattern.
Relative Strength Index (RSI)
If the Dragonfly Doji appears when RSI indicates oversold conditions, the probability of a bullish reversal increases.
Moving Averages
A Dragonfly Doji near a major moving average can provide additional confirmation.
Volume Analysis
Higher trading volume during the formation of the Dragonfly Doji often strengthens the signal.
MACD Indicator
A bullish crossover in MACD along with a Dragonfly Doji can support a bullish trading view.
Advantages of the Dragonfly Doji
- Easy to Identify: Its unique T-shaped structure is easy to recognize.
- Useful Reversal Signal: Helps identify potential trend reversals early.
- Works Across Markets: Applicable in stocks, forex, commodities, and crypto.
- Multiple Time Frames: Effective on intraday, daily, weekly, and monthly charts.
Limitations of the Dragonfly Doji
- Not Always Accurate: No pattern guarantees success.
- Requires Confirmation: Trading without it increases risk.
- Market Context Matters: Effectiveness depends on trend direction.
- False Signals: Highly volatile markets can cause patterns to fail.
Conclusion
The Dragonfly Doji is a powerful candlestick pattern that helps traders identify potential market reversals. While it is a valuable tool, it should never be used in isolation. Combining it with support and resistance levels, volume analysis, and indicators like RSI or MACD will significantly improve your trading decisions.