
Introduction
The Morning Star candle pattern is one of the most reliable bullish reversal patterns in technical analysis. It helps traders identify potential trend reversals and possible buying opportunities after a downtrend. Because of its high reliability and easy identification, the Morning Star pattern is widely used by stock market traders, forex traders, and cryptocurrency investors.
Candlestick patterns provide valuable insights into market sentiment. The Morning Star pattern is particularly important because it signals that selling pressure is weakening and buyers are beginning to take control. When used with proper confirmation and risk management, this pattern can help traders make informed trading decisions.
In this article, you will learn everything about the Morning Star candle pattern, including its formation, psychology, trading strategies, advantages, limitations, and practical applications.
What is a Morning Star Candle Pattern?A Morning Star is a three-candlestick bullish reversal pattern that usually appears after a downtrend. It signals a potential shift from bearish sentiment to bullish sentiment.
The pattern consists of three candles:
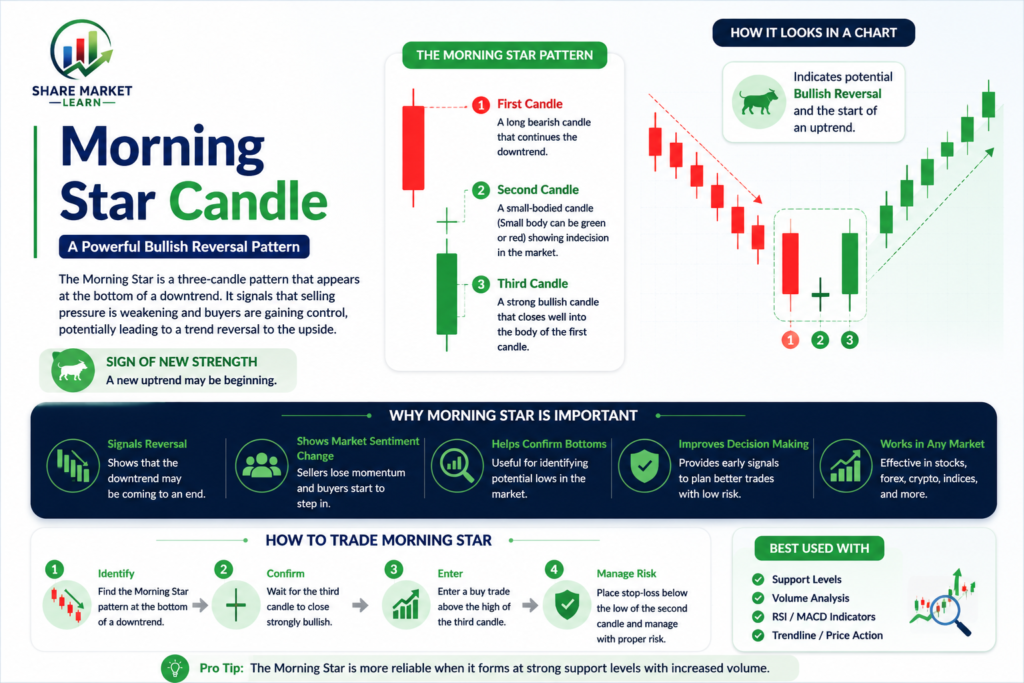
- A large bearish candle
- A small-bodied candle showing indecision
- A large bullish candle
The Morning Star pattern indicates that sellers initially dominated the market, but buyers gradually gained strength and eventually took control.
Because of this transition in market sentiment, traders often view the Morning Star as a strong bullish reversal signal.
Structure of a Morning Star Pattern
Understanding the structure of the Morning Star is essential for accurate identification.
First Candle: Strong Bearish Candle
The first candle is a large red or bearish candle.
This candle confirms that sellers are in control and the market is experiencing downward momentum.
Second Candle: Small Body Candle
The second candle has a small body and may appear as:
- A Doji
- A Spinning Top
- A Small Bullish Candle
- A Small Bearish Candle
This candle represents indecision between buyers and sellers.
Third Candle: Strong Bullish Candle
The third candle is a large bullish candle.
It closes well into the body of the first bearish candle, showing that buyers have taken control of the market.
This candle provides confirmation of the bullish reversal.
How Does the Morning Star Pattern Form?
The Morning Star develops through a sequence of market events:
Stage 1: Strong Selling Pressure
The market is already in a downtrend, and sellers continue pushing prices lower.
Stage 2: Market Indecision
The second candle forms with a small body, showing that selling momentum is slowing down.
Neither buyers nor sellers have complete control.
Stage 3: Buyers Take Control
The third bullish candle appears as buyers enter the market aggressively.
The strong upward move indicates a shift in momentum from sellers to buyers.
This transition creates the Morning Star pattern and signals a possible bullish reversal.
Psychology Behind the Morning Star Pattern
Understanding trader psychology helps explain why the Morning Star pattern works.
First Candle Psychology
The first bearish candle reflects fear and strong selling activity.
Market participants believe prices may continue falling.
Second Candle Psychology
The small candle represents uncertainty.
Sellers begin losing confidence, while buyers start entering the market.
The balance between demand and supply becomes more equal.
Third Candle Psychology
The strong bullish candle shows that buyers have gained control.
Confidence returns to the market, and the possibility of an upward trend increases.
This shift in sentiment makes the Morning Star one of the most respected reversal patterns.
Importance of the Morning Star Pattern
The Morning Star pattern is important because it helps traders:
- Identify potential trend reversals
- Find buying opportunities
- Improve market timing
- Understand market sentiment
- Confirm support levels
Many traders use this pattern as part of their overall trading strategy rather than relying on it alone.
Morning Star Trading Strategy
Step 1: Identify a Downtrend
Look for a stock, index, commodity, or cryptocurrency that has been declining.
A Morning Star is most effective when it appears after a clear downtrend.
Step 2: Spot the Three-Candle Formation
Verify that the pattern includes:
- A strong bearish candle
- A small indecision candle
- A strong bullish candle
Step 3: Wait for Confirmation
Confirmation is important before entering a trade.
Many traders wait for:
- The next candle to close bullish
- Increased trading volume
- A breakout above nearby resistance
Step 4: Enter the Trade
After confirmation, traders may consider entering a long position.
Step 5: Place a Stop Loss
A stop loss is commonly placed below the lowest point of the pattern.
This helps manage risk if the market moves against the trade.
Step 6: Set Profit Targets
Profit targets can be based on:
- Previous resistance levels
- Risk-reward ratios
- Technical indicators
Using Morning Star with Support and Resistance
Support and resistance levels can significantly improve the effectiveness of the Morning Star pattern.
Morning Star at Support
When the pattern forms near a major support level, it often becomes more reliable.
The support zone acts as an area where buyers may enter the market.
Morning Star Near Resistance
If the pattern forms close to resistance, traders should exercise caution because upward movement may face obstacles.
Combining candlestick analysis with support and resistance creates stronger trading setups.
Combining Morning Star with Technical Indicators
Professional traders often use additional indicators for confirmation.
Relative Strength Index (RSI)
A Morning Star appearing in an oversold RSI zone can strengthen the bullish signal.
Moving Averages
If the pattern forms near an important moving average, it may provide additional confirmation.
MACD Indicator
A bullish MACD crossover alongside a Morning Star can increase confidence in the trade.
Volume Analysis
Higher volume during the third bullish candle suggests strong buying interest and improves the reliability of the pattern.
Advantages of the Morning Star Pattern
Easy to Recognize
The three-candle structure is relatively easy to identify on charts.
Strong Reversal Signal
The pattern often signals a meaningful shift in market sentiment.
Works in Multiple Markets
It can be used in:
- Stock markets
- Forex markets
- Commodity markets
- Cryptocurrency markets
Suitable for Different Time Frames
The pattern works on:
- Intraday charts
- Daily charts
- Weekly charts
- Monthly charts
Limitations of the Morning Star Pattern
Not Always Accurate
No trading pattern guarantees success.
Requires Confirmation
Trading immediately after spotting the pattern can lead to false signals.
Market Conditions Matter
The pattern performs best in favorable market environments.
Risk Management Is Still Necessary
Even strong patterns can fail, making stop-loss placement essential.
Difference Between Morning Star and Evening Star
Many beginners confuse the Morning Star with the Evening Star pattern.
Morning Star
- Appears after a downtrend
- Bullish reversal signal
- Indicates buyers are gaining control
Evening Star
- Appears after an uptrend
- Bearish reversal signal
- Indicates sellers are gaining control
These patterns are essentially opposites of each other.
Common Mistakes Traders Make
Ignoring the Overall Trend
The Morning Star is most effective after a clear downtrend.
Entering Without Confirmation
Waiting for confirmation helps reduce false signals.
Ignoring Volume
Strong volume often supports the validity of the pattern.
Poor Risk Management
Failing to use stop losses can lead to significant losses.
Relying Only on Candlestick Patterns
Successful traders combine candlestick analysis with other technical tools.
Best Time Frames for Morning Star Trading
The Morning Star can be used across various time frames.
Popular choices include:
- 15-minute charts for intraday trading
- 1-hour charts for short-term trading
- Daily charts for swing trading
- Weekly charts for long-term investing
Generally, higher time frames produce more reliable signals than lower time frames.
Conclusion
The Morning Star candle pattern is one of the most effective bullish reversal patterns in technical analysis. It signals a possible transition from a bearish trend to a bullish trend and helps traders identify potential buying opportunities.
The pattern works because it reflects a clear change in market psychology. Sellers initially dominate the market, uncertainty follows, and buyers eventually take control. This shift often marks the beginning of a new upward movement.
However, traders should never rely solely on the Morning Star pattern. Combining it with support and resistance levels, RSI, MACD, moving averages, volume analysis, and proper risk management can significantly improve trading results.
By understanding the Morning Star pattern and applying it correctly, traders can make more confident decisions and improve their overall market analysis.
EO-Friendly URL Slug: