
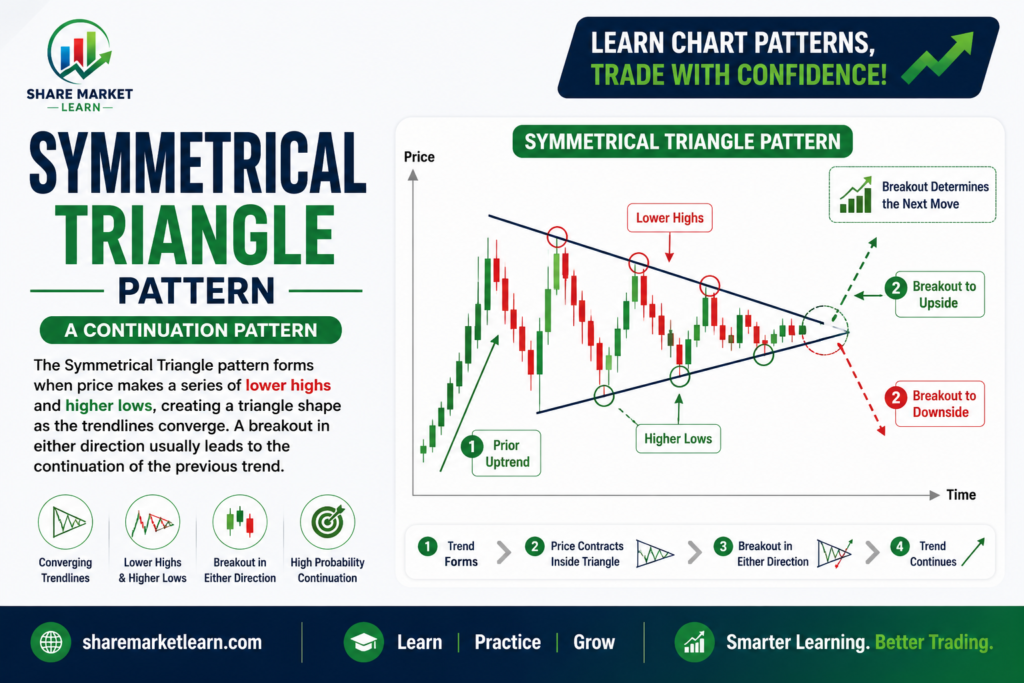
The Symmetrical Triangle Pattern is one of the most popular and reliable chart patterns in technical analysis. It helps traders identify periods of price consolidation before a potential breakout. This pattern can appear in stocks, forex, cryptocurrencies, commodities, and indices, making it a versatile tool for traders of all experience levels.
Unlike some chart patterns that predict only bullish or bearish movements, the Symmetrical Triangle is considered a neutral pattern because the breakout can occur in either direction. The direction of the breakout often depends on the overall market trend and buying or selling pressure.
In this guide, you’ll learn what the Symmetrical Triangle Pattern is, how it forms, how to trade it effectively, common mistakes to avoid, and practical tips to improve your trading success.
What is a Symmetrical Triangle Pattern?
A Symmetrical Triangle Pattern is a chart pattern formed when the price creates lower highs and higher lows, causing two trendlines to converge toward each other.
The upper trendline slopes downward, while the lower trendline slopes upward, forming a triangle shape.
As the price moves within the triangle, volatility decreases. Eventually, buyers or sellers gain control, leading to a breakout above the resistance line or below the support line.
Because the breakout can happen in either direction, traders wait for confirmation before entering a trade.
Characteristics of a Symmetrical Triangle Pattern
The pattern has several important features:
- Forms after a strong trend or during market consolidation.
- Contains lower highs and higher lows.
- Two converging trendlines create a triangle shape.
- Trading volume often decreases as the pattern develops.
- A breakout with higher volume confirms the pattern.
- Can lead to either bullish or bearish continuation, depending on the breakout direction.
Recognizing these characteristics can help traders identify valid setups.
How Does the Symmetrical Triangle Pattern Form?
The formation typically follows these stages:
1. Existing Trend
The market is already moving upward or downward before the triangle begins.
2. Price Consolidation
Buyers and sellers reach a temporary balance, causing the price to move within a narrowing range.
3. Converging Trendlines
Each rally makes a lower high, while each pullback forms a higher low, creating the triangle.
4. Reduced Volatility
As the triangle narrows, price swings become smaller and trading volume often declines.
5. Breakout
Eventually, the price breaks above resistance or below support, usually accompanied by increased volume.
Psychology Behind the Symmetrical Triangle
The Symmetrical Triangle reflects a period of indecision in the market.
After a strong move, buyers and sellers become evenly matched. Buyers prevent prices from falling too much, while sellers stop prices from rising significantly. This tug-of-war creates lower highs and higher lows.
As the range tightens, pressure builds. Eventually, one side gains control, leading to a strong breakout. This is why traders often describe the pattern as a “coiled spring” that releases energy once price escapes the triangle.
How to Identify a Symmetrical Triangle
Follow these steps:
Step 1
Identify an existing trend or a significant price move.
Step 2
Draw a descending trendline connecting at least two lower highs.
Step 3
Draw an ascending trendline connecting at least two higher lows.
Step 4
Ensure the two trendlines converge to form a triangle.
Step 5
Wait for a confirmed breakout with increased trading volume before entering a trade.
Avoid trading while the price is still moving inside the triangle without confirmation.
Trading Strategy for the Symmetrical Triangle Pattern
Entry
Enter a trade only after the price closes outside the triangle:
- Buy when the price breaks above the upper trendline.
- Sell when the price breaks below the lower trendline.
Conservative traders often wait for a retest of the broken trendline before entering.
Stop Loss
Place the stop loss:
- Below the breakout candle for bullish trades.
- Above the breakout candle for bearish trades.
- Alternatively, outside the opposite side of the triangle.
Profit Target
A common method is to measure the height of the widest part of the triangle and project that distance from the breakout point.
This provides a logical target based on the pattern’s structure.
Example
Imagine a stock rises from ₹200 to ₹240, then begins forming lower highs and higher lows.
The price consolidates inside a Symmetrical Triangle for several weeks.
Eventually, it breaks above the upper trendline with strong trading volume.
A trader enters a buy position after the breakout, places a stop loss below the breakout level, and sets a profit target equal to the height of the triangle projected upward from the breakout point.
Advantages of the Symmetrical Triangle Pattern
- Easy to recognize on charts.
- Suitable for beginners and experienced traders.
- Works in stocks, forex, crypto, commodities, and indices.
- Can identify strong breakout opportunities.
- Provides clear entry, stop loss, and target levels.
- Effective across multiple timeframes.
Disadvantages of the Symmetrical Triangle Pattern
- False breakouts can occur.
- Volume confirmation is essential but sometimes overlooked.
- Breakout direction is uncertain until confirmation.
- Waiting for confirmation may cause traders to miss part of the move.
- No chart pattern guarantees success.
Common Mistakes to Avoid
Many traders make these common mistakes:
- Entering before the breakout.
- Ignoring trading volume.
- Drawing incorrect trendlines.
- Trading against the overall trend without confirmation.
- Using stop losses that are too tight.
- Risking too much capital on a single trade.
Avoiding these mistakes can improve consistency and reduce unnecessary losses.
Tips for Better Trading
- Always wait for a candle close outside the triangle.
- Confirm the breakout with increased volume.
- Trade in the direction of the broader market trend whenever possible.
- Combine the pattern with indicators such as RSI, MACD, or Moving Averages.
- Use proper risk management and avoid risking more than 1–2% of your trading capital on one trade.
- Practice identifying the pattern on historical charts before using it in live trading.
Conclusion
The Symmetrical Triangle Pattern is a powerful chart pattern that signals a period of consolidation before a potential breakout. Since the breakout can occur in either direction, patience and confirmation are essential.
By combining the Symmetrical Triangle with volume analysis, trend confirmation, and sound risk management, traders can improve the quality of their trading decisions. While no strategy is perfect, consistent practice and disciplined execution can help you use this pattern more effectively in different market conditions.
Frequently Asked Questions (FAQs)
1. Is the Symmetrical Triangle pattern bullish or bearish?
It is considered a neutral pattern because the breakout can occur either upward or downward. The direction is confirmed only after the breakout.
2. Can beginners trade the Symmetrical Triangle pattern?
Yes. It is one of the easiest chart patterns to identify and is suitable for beginners with a basic understanding of trendlines.
3. Which markets does the Symmetrical Triangle work in?
It can be used in stocks, forex, cryptocurrencies, commodities, and market indices.
4. Why is volume important?
A breakout supported by higher trading volume is generally considered more reliable than a breakout on low volume.
5. Which indicators work well with the Symmetrical Triangle?
Many traders use RSI, MACD, Moving Averages, Bollinger Bands, and Volume indicators to confirm breakout strength.
6. Can the Symmetrical Triangle fail?
Yes. Like all technical patterns, false breakouts can happen. Using stop losses and proper risk management helps protect trading capital.