Introduction
One of the most important skills in stock market trading and investing is identifying whether a stock is moving in an uptrend or a downtrend. Understanding the direction of the market can help traders make better buying and selling decisions while reducing the chances of losses. Many beginners enter trades without checking the trend and often end up buying during a downtrend or selling during an uptrend. Learning how to identify market trends can significantly improve trading results. In this article, we will explain what an uptrend and downtrend are, how to identify them, and the tools that traders use to recognize market direction.
What is a Trend in the Share Market?
A trend refers to the overall direction in which a stock or market is moving over a period of time. Trends help traders understand whether buyers or sellers are dominating the market. There are three main types of trends:
Uptrend
A market moving upward with higher prices over time.
Downtrend
A market moving downward with lower prices over time.
Sideways Trend
A market moving within a range without a clear upward or downward direction.
What is an Uptrend?
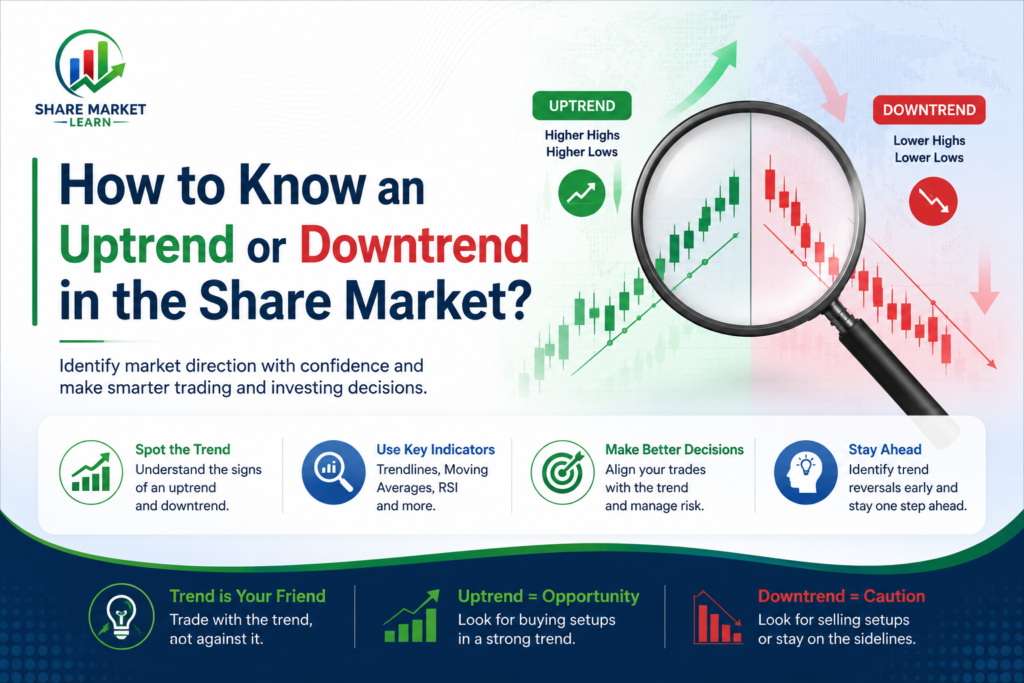
An uptrend occurs when a stock continuously makes higher highs and higher lows. This indicates that buyers are stronger than sellers and demand is pushing prices higher.
Characteristics of an Uptrend
- Higher highs are formed regularly.
- Higher lows are formed after each correction.
- Buying pressure is stronger than selling pressure.
- Market sentiment remains positive.
Example of an Uptrend
Suppose a stock moves from ₹100 to ₹120, then falls to ₹110, rises to ₹140, falls to ₹130, and then rises again to ₹160. The stock is creating higher highs and higher lows, indicating an uptrend.
What is a Downtrend?
A downtrend occurs when a stock continuously creates lower highs and lower lows. This shows that sellers are dominating the market and prices are gradually declining.
Characteristics of a Downtrend
- Lower highs are formed repeatedly.
- Lower lows are created after every decline.
- Selling pressure is stronger than buying pressure.
- Market sentiment remains negative.
Example of a Downtrend
Suppose a stock falls from ₹500 to ₹450, rises to ₹470, falls again to ₹420, rises to ₹440, and then falls to ₹390. This pattern of lower highs and lower lows indicates a downtrend.
Method 1: Use Higher Highs and Higher Lows
The simplest way to identify an uptrend is by observing price action.
Uptrend Pattern
- Higher High
- Higher Low
- Higher High
- Higher Low
This pattern indicates that buyers are continuously pushing prices upward.
Downtrend Pattern
- Lower High
- Lower Low
- Lower High
- Lower Low
This pattern shows that sellers are controlling the market.
Method 2: Use Moving Averages
Moving averages are among the most popular trend-identification tools.
50-Day Moving Average
Used to identify medium-term trends.
200-Day Moving Average
Used to identify long-term trends.
Uptrend Signal
When the stock price remains above the moving average and the moving average is sloping upward.
Downtrend Signal
When the stock price remains below the moving average and the moving average is sloping downward.
Many traders use the 50-day and 200-day moving averages together for confirmation.
Method 3: Trendline Analysis
Trendlines are simple lines drawn on a stock chart.
Uptrend Trendline
Connect the higher lows using a straight line. If the stock continues respecting the trendline, the uptrend remains intact.
Downtrend Trendline
Connect the lower highs using a straight line. If the stock continues facing resistance at the trendline, the downtrend remains active.
Trendlines provide a visual representation of market direction.
Method 4: Support and Resistance Levels
Support and resistance are important concepts in technical analysis.
Support
A price level where buyers tend to enter and stop prices from falling further.
Resistance
A price level where sellers tend to enter and stop prices from rising further.
Uptrend Indication
Support levels continue moving higher.
Downtrend Indication
Resistance levels continue moving lower.
This helps traders understand whether momentum remains strong or weak.
Method 5: Volume Analysis
Volume represents the number of shares traded during a specific period.
Uptrend with Strong Volume
When prices rise and volume increases, it confirms buying interest.
Downtrend with Strong Volume
When prices fall and volume increases, it confirms selling pressure.
Volume often acts as confirmation for trend strength.
Method 6: Use the 52-Week High and Low
The 52-week high and low provide useful clues about trend direction.
Uptrend Signal
A stock trading near its 52-week high often indicates strong bullish momentum.
Downtrend Signal
A stock trading near its 52-week low may indicate weakness and bearish sentiment.
Many professional investors monitor these levels before making decisions.
Method 7: Relative Strength Index (RSI)
RSI is a momentum indicator used by traders.
RSI Above 50
Generally indicates bullish momentum.
RSI Below 50
Generally indicates bearish momentum.
RSI Above 70
May indicate overbought conditions.
RSI Below 30
May indicate oversold conditions.
RSI should be used with other indicators for better accuracy.
Common Mistakes While Identifying Trends
Ignoring the Bigger Time Frame
A stock may appear bullish on a 15-minute chart but bearish on a daily chart.
Trading Against the Trend
Buying in a strong downtrend or selling in a strong uptrend increases risk.
Depending on One Indicator
No single indicator is perfect. Combining price action, volume, and moving averages often gives better results.
Emotional Decisions
Fear and greed can cause traders to misread market trends.
Tips for Beginners
- Always identify the trend before entering a trade.
- Follow the trend rather than predicting reversals.
- Use stop-loss orders to manage risk.
- Confirm trends using multiple indicators.
- Focus on learning price action.
- Avoid making decisions based on rumors.
- Practice using historical charts before trading with real money.
Conclusion
Understanding uptrends and downtrends is one of the foundations of successful trading and investing. An uptrend is characterized by higher highs and higher lows, while a downtrend is identified by lower highs and lower lows. Traders can use moving averages, trendlines, support and resistance levels, volume analysis, RSI, and price action to identify market direction. No method is perfect, but combining multiple tools can improve accuracy and confidence. For beginners, the best approach is to trade in the direction of the trend and focus on risk management. With practice and discipline, identifying market trends becomes much easier and can significantly improve trading performance.