
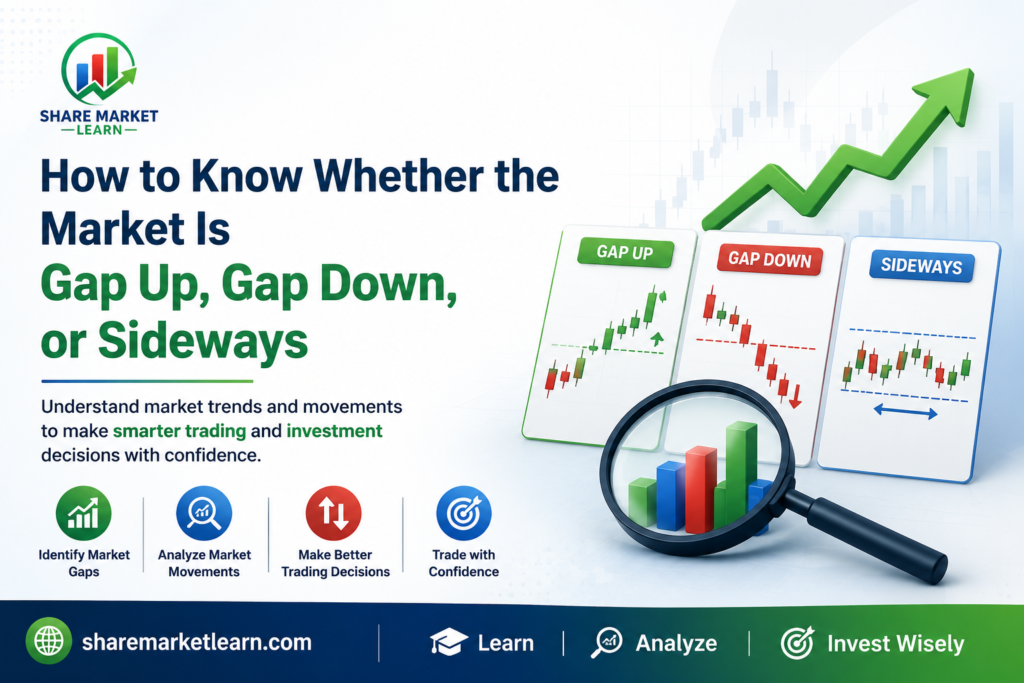
If you follow the stock market, you may have noticed that sometimes the market opens much higher than the previous day’s closing price. On other days, it opens much lower. Sometimes, however, the market moves within a narrow range without showing a clear upward or downward direction.
These situations are commonly described as gap up, gap down, and sideways markets.
Understanding the market’s opening condition and overall trend can help traders plan their trades more carefully. It can also help beginners avoid entering trades without understanding what the market is doing.
In this article, we will explain what gap up, gap down, and sideways markets mean, how to identify them, what causes them, and how beginners can analyze market conditions using simple methods.
Important: Market direction cannot be predicted with certainty. Gap and sideways analysis should be used as part of a broader trading and risk-management process, not as a guarantee of profits.
What Is a Gap Up?
A gap up occurs when the market opens significantly above the previous trading session’s closing level.
For example:
- Previous day’s close: 22,000
- Today’s opening: 22,200
The market has opened 200 points higher than the previous close.
This is called a gap up.
A gap up can happen because of positive news, strong global market cues, company announcements, economic data, overnight events, or strong buying interest.
Does Gap Up Always Mean the Market Will Rise?
No.
This is an important point for beginners.
A market can open with a gap up and then fall during the trading session. This can happen when early buyers lose strength and sellers enter the market.
Therefore, do not assume that gap up automatically means bullish trading for the entire day.
Instead, observe what happens after the opening.
What Is a Gap Down?
A gap down occurs when the market opens below the previous trading session’s closing level.
For example:
- Previous day’s close: 22,000
- Today’s opening: 21,800
The market has opened 200 points lower.
This is called a gap down.
Gap downs can occur because of negative news, weak global markets, economic developments, company-specific news, or heavy overnight selling pressure.
Does Gap Down Always Mean the Market Will Fall?
Not necessarily.
The market may open lower but recover during the session.
For example, a market may gap down because of negative overnight news, but buyers may enter at lower levels and push prices higher.
So again, the opening gap is only the starting point. You need to observe subsequent price action.
What Is a Sideways Market?
A sideways market, also called a range-bound or consolidating market, occurs when prices move within a relatively defined range without a strong sustained upward or downward trend.
For example, imagine an index repeatedly moving between:
21,800 and 22,000
If price keeps moving between these levels without a clear breakout, the market may be considered sideways.
A sideways market can be challenging because traders may receive false signals.
The market may move up temporarily and then reverse. It may also fall toward support and quickly bounce back.
How to Identify a Sideways Market
There are several simple ways beginners can identify a sideways market.
1. Look at Support and Resistance
Support is a price area where buying interest may appear.
Resistance is a price area where selling pressure may appear.
If the market repeatedly moves between the same support and resistance areas, it may indicate a range-bound market.
2. Look at Price Movement
If the market is making:
- No clear higher highs
- No clear higher lows
- No clear lower highs
- No clear lower lows
it may be consolidating.
3. Observe Moving Averages
Moving averages can help identify trends.
When price moves strongly above or below a moving average, it may indicate directional momentum.
When price repeatedly crosses around a relatively flat moving average, it can sometimes indicate consolidation.
However, moving averages should not be used alone.
How to Know the Market Is Gap Up or Gap Down
One of the easiest methods is to compare the current opening price with the previous day’s closing price.
Gap Up Formula
Gap Up = Today’s Open > Previous Close
Example:
Previous close = ₹500
Today’s open = ₹515
Gap = ₹15
The stock has opened with a ₹15 gap up.
Gap Down Formula
Gap Down = Today’s Open < Previous Close
Example:
Previous close = ₹500
Today’s open = ₹485
Gap = ₹15
The stock has opened with a ₹15 gap down.
For indices such as NIFTY or BANK NIFTY, traders can compare the current opening level with the previous session’s closing level.
What Should You Observe After a Gap Up?
A gap up should not immediately be treated as a buying signal.
Instead, observe:
Opening Range
Watch how price behaves during the initial part of the session.
Does price remain above the opening level?
Does it break the initial high?
Does it quickly fall below the opening price?
Volume
Volume can provide additional information about market participation.
A strong price move accompanied by meaningful volume may be more significant than a move occurring on very low volume.
Support and Resistance
Identify important support and resistance levels before taking a trade.
For example, if the market gaps up directly into a major resistance zone, traders may want to be cautious rather than blindly buying.
What Should You Observe After a Gap Down?
The same principle applies to gap downs.
Do not automatically sell simply because the market opened lower.
Observe:
- Whether sellers continue to dominate
- Whether buyers defend an important support level
- Whether price moves back above the opening level
- Whether volume supports the move
- Whether the market breaks the day’s low or recovers
A gap down followed by strong buying can produce a very different trading environment from a gap down followed by continued selling.
How to Identify a Sideways Market During the Day
You can use a simple process.
Step 1: Mark the Day’s High and Low
After the market has traded for some time, identify the current high and low.
Step 2: Watch for Repeated Reversals
If price repeatedly approaches the same upper and lower areas and reverses, the market may be range-bound.
Step 3: Look for a Breakout
A sideways market can eventually break above resistance or below support.
However, traders should be careful about false breakouts, where price temporarily moves outside the range and then returns inside it.
Gap Up, Gap Down, and Sideways Market Comparison
| Market Condition | Basic Meaning | What to Watch |
|---|---|---|
| Gap Up | Opens above previous close | Buyers, resistance, continuation or reversal |
| Gap Down | Opens below previous close | Sellers, support, recovery or continuation |
| Sideways | Moves within a range | Support, resistance, breakout and volume |
Why Does the Market Gap?
Market gaps can happen because trading continues outside regular market hours through global markets, news, announcements, and other events.
Some common reasons include:
- Global market movements
- Economic announcements
- Company results
- Government policy changes
- Interest-rate decisions
- Geopolitical developments
- Major overnight news
- Changes in investor sentiment
This is why traders often check international market conditions and important news before the domestic market opens.
Can Indicators Help Identify Market Conditions?
Yes, technical indicators can provide additional information, but no indicator can predict the market with certainty.
Some commonly used tools include:
Moving Averages
Moving averages can help identify the general direction of price.
RSI
The Relative Strength Index (RSI) can help traders understand momentum and potential overbought or oversold conditions.
VWAP
VWAP (Volume Weighted Average Price) is widely used by intraday traders to understand the relationship between price and volume-weighted average price.
Bollinger Bands
Bollinger Bands can sometimes help identify periods of expansion and contraction in volatility.
The key is to use indicators as supporting information rather than relying on one indicator for every trading decision.
A Simple Morning Market Analysis Routine
If you are a beginner, you can follow this simple routine before taking an intraday trade.
Step 1: Check Previous Close
Write down the previous day’s closing price.
Step 2: Check Today’s Opening
Compare today’s opening price with yesterday’s close.
This tells you whether the market opened with a gap up, gap down, or little/no gap.
Step 3: Mark Important Levels
Identify:
- Previous day’s high
- Previous day’s low
- Previous day’s close
- Important support
- Important resistance
Step 4: Observe the First Price Movement
Do not rush into a trade immediately.
Watch how buyers and sellers behave.
Step 5: Identify the Market Structure
Ask:
Is the market trending upward?
Is the market trending downward?
Or is it moving sideways?
Step 6: Plan Your Risk
Before entering any trade, determine how much you are willing to lose if the trade goes against you.
This is particularly important in leveraged and derivatives trading.
Common Mistakes Beginners Should Avoid
Buying Immediately After a Gap Up
A gap up does not guarantee further upside.
Selling Immediately After a Gap Down
A gap down does not guarantee further downside.
Trading Every Breakout
Some breakouts fail.
Ignoring Risk Management
Even a good analysis can be wrong.
Using Too Many Indicators
A chart filled with indicators can create confusion instead of clarity.
Start with a few tools and learn how price behaves.
Conclusion
Understanding gap up, gap down, and sideways markets is an important part of learning technical analysis and intraday trading.
A gap up means the market opens above the previous close, while a gap down means it opens below the previous close. A sideways market occurs when price moves within a relatively defined range without establishing a strong trend.
The most important lesson is simple: don’t trade only because the market has gapped up or down.
Instead, observe price action, support and resistance, volume, market structure, and important news. Combine these observations with proper risk management and a clear trading plan.
With practice, you can become better at recognizing whether the market is trending, reversing, or simply moving sideways.
Frequently Asked Questions
1. What is a gap up in the stock market?
A gap up occurs when a stock or index opens above its previous trading session’s closing price.
2. What is a gap down?
A gap down occurs when a stock or index opens below its previous trading session’s closing price.
3. What is a sideways market?
A sideways market is one where price generally moves within a range without a strong sustained upward or downward trend.
4. Is gap up bullish?
A gap up can indicate positive opening sentiment, but it does not guarantee that the market will remain bullish throughout the day.
5. Is gap down bearish?
A gap down can indicate negative opening sentiment, but the market may recover if buyers enter strongly.
6. How can I identify a sideways market?
Look for repeated price movement between established support and resistance levels without a sustained trend.
7. Should beginners trade immediately after a gap up or gap down?
Beginners should avoid making decisions solely from the opening gap. It is generally better to observe price action, key levels, volume, and risk before entering a trade.
8. Can indicators predict whether the market will go up or down?
No indicator can reliably predict future market direction. Indicators can provide supporting information, but traders should combine them with price action and risk management.
9. What is the most important thing to remember?
A gap is an opening condition, not a guaranteed trading signal. Always analyze what happens after the market opens.