
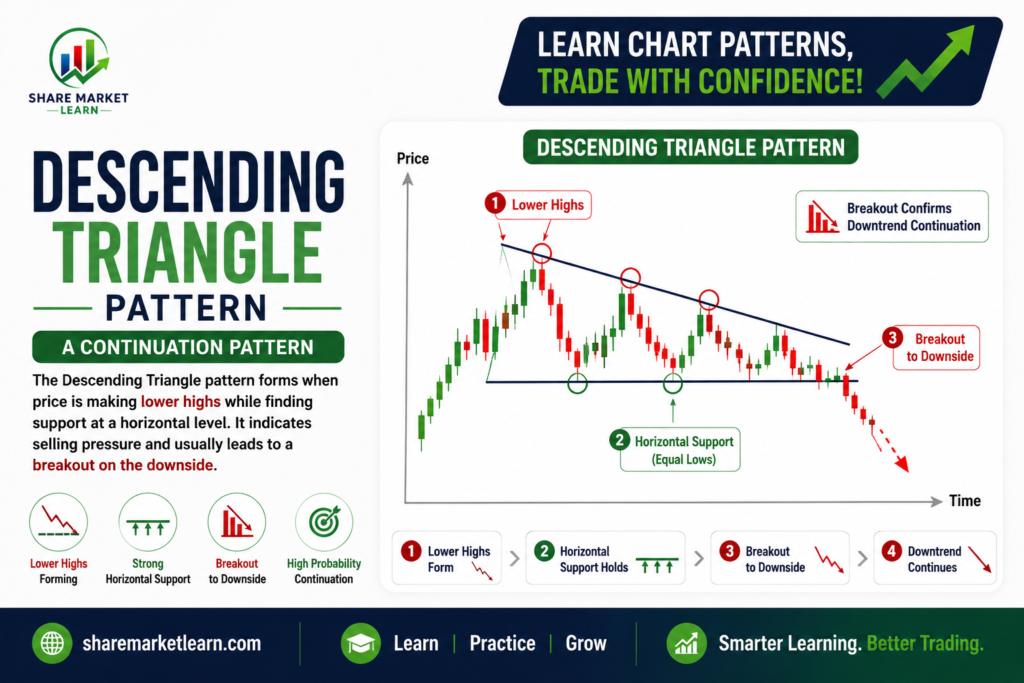
The Descending Triangle Pattern is one of the most popular chart patterns used in technical analysis. It helps traders identify potential bearish breakouts and make informed trading decisions. Whether you are a beginner or an experienced trader, understanding this pattern can improve your market analysis and trading confidence.
In this article, you’ll learn what a Descending Triangle is, how it forms, why it works, how to trade it, its advantages and disadvantages, and the mistakes to avoid.
What Is a Descending Triangle Pattern?
A Descending Triangle is a bearish continuation chart pattern that forms when the price creates lower highs while repeatedly finding support at the same horizontal price level.
This pattern indicates that sellers are becoming more aggressive. Although buyers continue defending the support level, their strength gradually weakens. Eventually, sellers overpower buyers, causing the price to break below the support level.
However, in some situations, the pattern can also act as a reversal pattern depending on the previous trend.
Characteristics of a Descending Triangle
A valid Descending Triangle usually has these features:
- A horizontal support line.
- A downward-sloping resistance line.
- Lower highs with each price swing.
- Declining trading volume during formation.
- Increased volume during the breakout.
- A bearish breakout below support.
These characteristics help traders identify a high-quality setup.
How Does a Descending Triangle Form?
The pattern develops in several stages:
1. Strong Downtrend
The market is already moving downward before the pattern begins.
2. Support Is Established
Buyers repeatedly defend the same support level, preventing the price from falling further.
3. Lower Highs Continue
Each upward bounce becomes weaker than the previous one. This shows that sellers are taking control.
4. Price Compression
The trading range becomes smaller as the price moves toward the triangle’s apex.
5. Breakdown
Eventually, sellers push the price below the support level, confirming the bearish breakout.
Psychology Behind the Descending Triangle
Understanding market psychology makes this pattern easier to trust.
- Buyers continue protecting the same support zone.
- Sellers become increasingly aggressive and sell at lower prices.
- Buyers lose momentum with every bounce.
- Market pressure builds inside the triangle.
- Once support breaks, many buyers exit while new sellers enter, accelerating the decline.
This battle between buyers and sellers creates the recognizable triangle shape.
How to Identify a Descending Triangle
Use the following checklist:
- Price is making lower highs.
- Support remains nearly horizontal.
- The pattern contains at least two or three touches on both trendlines.
- Trading volume decreases while the pattern forms.
- A breakout occurs with strong volume.
The more confirmations present, the stronger the pattern becomes.
How to Trade the Descending Triangle Pattern
Step 1: Identify the Pattern
Wait until the triangle is clearly visible with multiple touches on support and resistance.
Step 2: Wait for Confirmation
Never enter before the breakout. Wait for a candle to close below the support level.
Step 3: Enter the Trade
Many traders enter a short position immediately after the confirmed breakout or after a pullback to the broken support.
Step 4: Place the Stop-Loss
A common stop-loss location is:
- Above the last lower high.
- Above the descending trendline.
This helps limit risk if the breakout fails.
Step 5: Set the Target
Measure the height of the triangle at its widest point and project the same distance downward from the breakout point.
This technique provides a logical profit target.
Example of a Descending Triangle
Imagine a stock repeatedly finds support at ₹1,000.
Meanwhile, the highs gradually fall:
- ₹1,080
- ₹1,060
- ₹1,040
- ₹1,020
Eventually, the stock breaks below ₹1,000 with strong volume.
This confirms the Descending Triangle breakout, suggesting further downside movement.
Advantages of the Descending Triangle
Easy to Identify
The pattern has a simple structure that beginners can recognize.
High Probability
When combined with volume confirmation, it often produces reliable signals.
Works Across Markets
It can be used in:
- Stocks
- Forex
- Cryptocurrency
- Commodities
- Indices
Suitable for Multiple Time Frames
The pattern works on intraday, swing, and long-term charts.
Clear Risk Management
The trendline and support level provide natural entry, stop-loss, and target zones.
Disadvantages of the Descending Triangle
False Breakouts
Sometimes the price briefly breaks support before reversing upward.
Requires Confirmation
Entering too early increases the risk of losses.
Market Conditions Matter
The pattern performs better in trending markets than in sideways conditions.
Volume Is Important
Weak breakout volume may reduce the reliability of the signal.
Common Mistakes to Avoid
Many traders lose money because they:
- Enter before the breakout.
- Ignore trading volume.
- Trade against the overall market trend.
- Place the stop-loss too close.
- Risk too much capital on one trade.
- Ignore proper risk management.
Avoiding these mistakes can significantly improve trading performance.
Tips for Better Trading
- Wait for a confirmed candle close below support.
- Check if breakout volume is higher than average.
- Combine the pattern with indicators like RSI, MACD, or Moving Averages.
- Follow the overall market trend.
- Maintain a minimum risk-reward ratio of 1:2.
- Always use a stop-loss.
Best Indicators to Use with a Descending Triangle
For stronger confirmation, combine the pattern with:
Relative Strength Index (RSI)
Helps identify bearish momentum and overbought conditions.
Moving Averages
Confirms the overall trend direction.
MACD
Shows momentum shifts and potential continuation.
Volume Indicator
A breakout supported by higher volume is generally more reliable.
Is the Descending Triangle Always Bearish?
Not always.
Although it is primarily considered a bearish continuation pattern, market conditions can occasionally produce an upside breakout. This is why traders should always wait for confirmation instead of predicting the breakout direction.
Following price action is more reliable than making assumptions.
Conclusion
The Descending Triangle Pattern is one of the most effective bearish chart patterns in technical analysis. It reflects increasing selling pressure while buyers struggle to defend an important support level. Once support breaks with strong volume, traders often see a continuation of the downward trend.
Like any trading strategy, the Descending Triangle should not be used alone. Combining it with volume analysis, trend confirmation, technical indicators, and disciplined risk management can improve its effectiveness.
Practice identifying this pattern on historical charts before using it in live trading. Consistent practice and patience are key to becoming a successful trader.
Frequently Asked Questions (FAQs)
1. What is a Descending Triangle Pattern?
A Descending Triangle is a bearish chart pattern formed by a horizontal support line and a downward-sloping resistance line, indicating increasing selling pressure.
2. Is the Descending Triangle bullish or bearish?
It is primarily a bearish continuation pattern, although it can occasionally break upward in certain market conditions.
3. Which timeframe is best for a Descending Triangle?
The pattern works on all timeframes, but many traders prefer the 1-hour, 4-hour, daily, and weekly charts for higher reliability.
4. Should I trade before the breakout?
No. Waiting for a confirmed breakout helps reduce the risk of false signals.
5. Which indicators work best with a Descending Triangle?
RSI, MACD, Moving Averages, and Volume indicators are commonly used to confirm breakout strength.
6. Can beginners trade the Descending Triangle?
Yes. It is one of the easiest chart patterns to identify and is suitable for beginners when combined with proper risk management.