
Introduction
The Bullish Pin Bar is one of the most popular and reliable candlestick patterns used in technical analysis. Traders across stocks, forex, commodities, and cryptocurrency markets use this pattern to identify potential buying opportunities and trend reversals.
A Bullish Pin Bar reflects a strong rejection of lower prices and indicates that buyers have stepped into the market with confidence. When used correctly along with other technical analysis tools, it can help traders make informed decisions and improve their trading performance.
This article explains the Bullish Pin Bar pattern in simple terms, including its meaning, formation, characteristics, trading strategies, advantages, and limitations.
What Is a Bullish Pin Bar?
A Bullish Pin Bar is a single candlestick pattern that signals a potential upward price movement. The candle has a small real body near the top and a long lower wick or shadow. The long lower shadow shows that sellers pushed prices down during the trading session, but buyers eventually took control and drove prices back up.
This strong rejection of lower prices often suggests that bullish momentum may be building in the market.
The term “Pin Bar” comes from “Pinocchio Bar,” as the long wick represents a false move in one direction before the price reverses.
Characteristics of a Bullish Pin Bar
A valid Bullish Pin Bar usually has the following features:
- A small real body near the candle’s top.
- A long lower shadow that is at least two to three times larger than the body.
- A very small or no upper shadow.
- A closing price near the candle’s high.
- Strong rejection of lower prices.
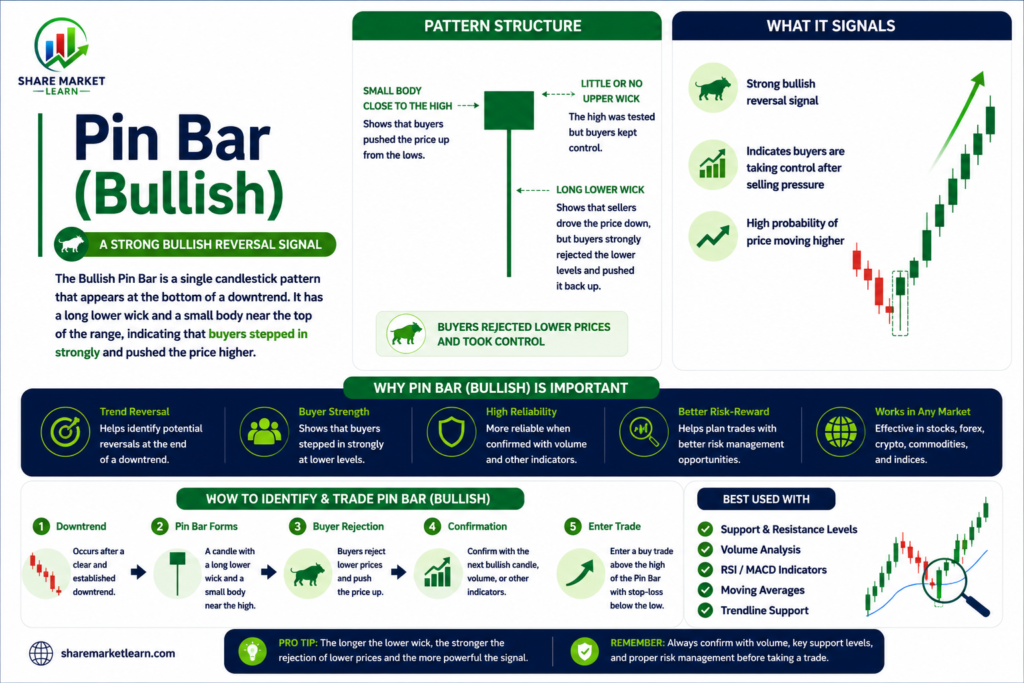
These characteristics help traders identify the pattern quickly on a price chart.
What Does a Bullish Pin Bar Indicate?
The Bullish Pin Bar provides valuable information about market sentiment.
Rejection of Lower Prices
The long lower wick shows that sellers initially controlled the market. However, buyers entered aggressively and pushed prices higher before the session closed.
Strength of Buyers
The pattern indicates that buyers are becoming stronger and may continue driving prices upward.
Potential Trend Reversal
When the Bullish Pin Bar appears after a downtrend, it can signal that bearish momentum is weakening and a reversal may occur.
Trend Continuation Signal
The pattern can also appear during an existing uptrend. In such cases, it often signals that the trend may continue higher after a temporary pullback.
How Is a Bullish Pin Bar Formed?
A Bullish Pin Bar forms when the following market conditions occur:
- Sellers push the price lower during the session.
- Buyers enter the market and absorb the selling pressure.
- The price recovers strongly.
- The candle closes near its high.
This price action creates the long lower shadow and small body that define the pattern.
Importance of the Bullish Pin Bar Pattern
The Bullish Pin Bar is widely used because it clearly shows a shift in market control from sellers to buyers.
Its importance includes:
- Easy identification on charts.
- Useful for beginners and experienced traders.
- Applicable across multiple markets.
- Effective on various timeframes.
- Helps identify potential entry opportunities.
Because of its simplicity and effectiveness, it remains one of the most recognized candlestick patterns in technical analysis.
Best Locations for a Bullish Pin Bar
The location of the pattern is often more important than the pattern itself.
At Support Levels
A Bullish Pin Bar forming near a strong support zone is generally considered a high-probability setup.
After a Downtrend
When the pattern appears after a significant price decline, it may indicate the beginning of a bullish reversal.
At Trendline Support
If the candle forms near an upward trendline, it may strengthen the bullish signal.
Near Moving Averages
Many traders watch for Bullish Pin Bars around major moving averages such as the 50-day or 200-day moving average.
How to Trade a Bullish Pin Bar
Entry Strategy
A common trading approach is to enter a buy trade when the price moves above the high of the Bullish Pin Bar candle.
This confirmation helps ensure that buyers remain in control.
Stop-Loss Placement
Risk management is essential in trading.
Most traders place their stop-loss below:
- The low of the Bullish Pin Bar.
- The nearby support level.
This helps limit losses if the trade does not work as expected.
Profit Target
Profit targets can be determined using:
- Previous resistance levels.
- Risk-reward ratios such as 1:2 or 1:3.
- Technical indicators.
A proper exit strategy helps traders protect profits and maintain discipline.
Importance of Volume Confirmation
Volume can improve the reliability of a Bullish Pin Bar signal.
When the pattern forms with above-average volume, it often indicates stronger buyer participation.
High volume suggests:
- Increased buying interest.
- Stronger reversal potential.
- Greater confidence in the setup.
Low volume may reduce the strength of the signal and increase the risk of false breakouts.
Bullish Pin Bar vs Other Bullish Candlestick Patterns
Bullish Pin Bar vs Hammer
Both patterns look similar and indicate potential reversals. However, the Pin Bar places greater emphasis on price rejection and market context.
Bullish Pin Bar vs Bullish Engulfing
A Bullish Engulfing pattern consists of two candles, while a Bullish Pin Bar uses only one candle.
Bullish Pin Bar vs Bullish Marubozu
A Bullish Marubozu shows strong buying throughout the session, while a Bullish Pin Bar highlights rejection of lower prices before buyers gain control.
Advantages of the Bullish Pin Bar Pattern
The Bullish Pin Bar offers several benefits:
- Easy to identify.
- Suitable for all financial markets.
- Works on different chart timeframes.
- Provides clear entry and stop-loss levels.
- Helps detect reversals early.
- Can be combined with other technical tools.
These advantages make it a favorite among many traders.
Limitations of the Bullish Pin Bar Pattern
Like any technical pattern, the Bullish Pin Bar is not perfect.
Some limitations include:
- False signals can occur.
- Market conditions may change unexpectedly.
- Low-volume patterns may be unreliable.
- News events can impact price movements.
- Confirmation is often necessary.
Using the pattern alone without additional analysis can increase trading risks.
Tips for Trading Bullish Pin Bars Successfully
Wait for Confirmation
Avoid entering trades immediately after spotting the pattern. Confirmation helps improve accuracy.
Use Support and Resistance
Combining the pattern with key support and resistance levels can improve trading decisions.
Follow Proper Risk Management
Never risk more than a manageable portion of trading capital on a single trade.
Monitor Market Trends
Trading in the direction of the broader trend often increases the probability of success.
Combine With Indicators
Indicators such as RSI, Moving Averages, and MACD can provide additional confirmation.
Common Mistakes Traders Make
Many traders misuse the Bullish Pin Bar because they focus only on the candle shape.
Common mistakes include:
- Ignoring market context.
- Trading without confirmation.
- Using excessive leverage.
- Skipping stop-loss placement.
- Entering trades during low-volume periods.
Avoiding these mistakes can improve overall trading performance.
Conclusion
The Bullish Pin Bar is one of the most effective candlestick patterns for identifying potential buying opportunities and market reversals. Its long lower shadow and small body clearly demonstrate strong rejection of lower prices and growing buyer strength.
Although the pattern can provide valuable trading signals, it should always be used alongside support and resistance analysis, volume confirmation, trend assessment, and proper risk management. Traders who combine the Bullish Pin Bar with a disciplined trading plan are more likely to make informed decisions and improve their long-term trading results.