
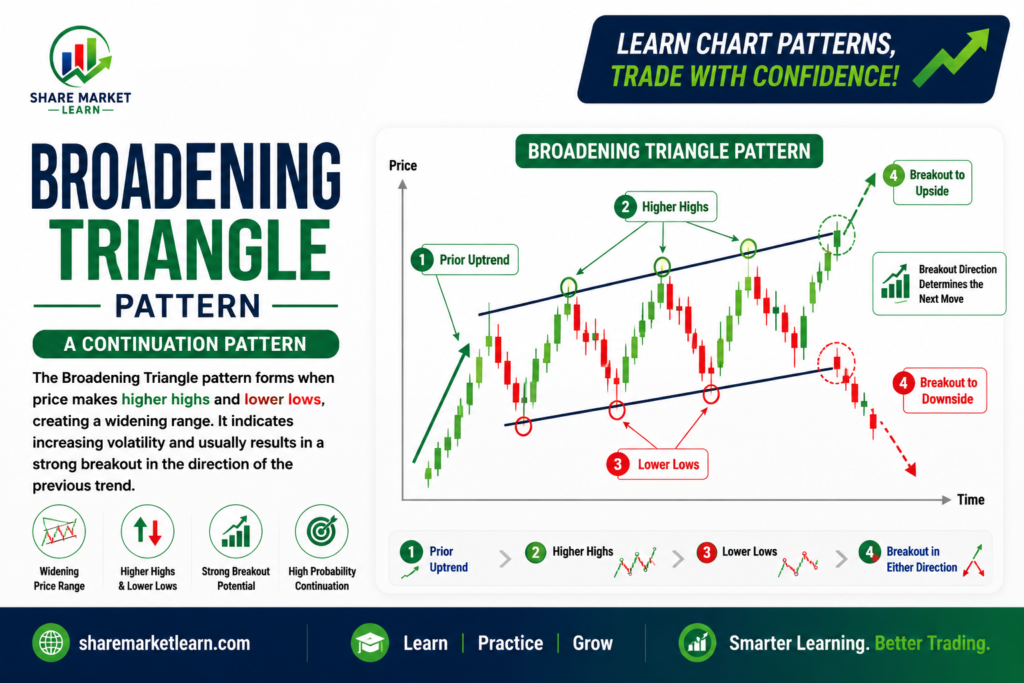
The Broadening Triangle Pattern, also known as the Megaphone Pattern, is one of the most interesting chart patterns in technical analysis. Unlike most triangle patterns that become narrower over time, the Broadening Triangle expands as price swings become larger. This increasing volatility reflects growing disagreement between buyers and sellers.
The pattern can appear in stocks, forex, cryptocurrencies, commodities, and indices. It may signal either a continuation or a reversal, depending on the direction of the breakout and the prevailing market trend.
In this guide, you’ll learn what the Broadening Triangle Pattern is, how it forms, how to identify it, effective trading strategies, common mistakes to avoid, and practical tips for improving your trading decisions.
What is a Broadening Triangle Pattern?
A Broadening Triangle Pattern is a chart pattern formed when the price creates higher highs and lower lows, causing two diverging trendlines to move farther apart. Instead of converging like a Symmetrical Triangle, the boundaries widen over time, creating a shape similar to a megaphone.
The pattern represents increasing volatility and uncertainty. Buyers continue pushing prices to new highs, while sellers drive prices to new lows. Eventually, one side gains control, resulting in a breakout.
Characteristics of a Broadening Triangle Pattern
The Broadening Triangle has several unique characteristics:
- Consists of higher highs and lower lows.
- Two diverging trendlines form the pattern.
- Price swings become larger over time.
- Indicates increasing market volatility.
- Can appear in both uptrends and downtrends.
- Breakout direction determines the trading signal.
- Volume often increases as volatility expands.
Recognizing these characteristics helps traders distinguish the Broadening Triangle from other chart patterns.
Types of Broadening Triangle Patterns
1. Bullish Broadening Triangle
Appears after an uptrend and often continues the upward movement if the price breaks above the upper trendline.
2. Bearish Broadening Triangle
Appears after a downtrend and may continue the downward movement if the price breaks below the lower trendline.
3. Broadening Top
Forms near market highs and can signal a bearish reversal if the price breaks downward.
4. Broadening Bottom
Forms near market lows and may indicate a bullish reversal if the price breaks upward.
How Does the Broadening Triangle Form?
The pattern develops in several stages:
1. Existing Trend
The market is already moving upward or downward before the pattern begins.
2. Increasing Price Swings
The market starts making higher highs and lower lows, showing stronger reactions from both buyers and sellers.
3. Diverging Trendlines
Trendlines drawn across the highs and lows spread apart, creating the broadening triangle.
4. Rising Volatility
Price movements become more aggressive, reflecting uncertainty and emotional trading.
5. Breakout
Eventually, the price breaks above resistance or below support, confirming the next market direction.
Psychology Behind the Broadening Triangle
The Broadening Triangle reflects a market where emotions are running high.
Buyers are optimistic and continue pushing prices higher, while sellers aggressively drive prices lower after each rally. Neither side can maintain complete control, resulting in wider price swings.
As volatility increases, market participants become more emotional. Eventually, one group overpowers the other, causing a decisive breakout that often leads to a strong price move.
Understanding this psychology helps traders remain patient and avoid entering trades too early.
How to Identify a Broadening Triangle
Follow these simple steps:
Step 1
Identify an existing trend or significant price movement.
Step 2
Draw a trendline connecting at least two higher highs.
Step 3
Draw another trendline connecting at least two lower lows.
Step 4
Ensure the trendlines diverge instead of converging.
Step 5
Wait for a confirmed breakout before entering a trade.
Avoid predicting the breakout direction while the price is still inside the pattern.
Trading Strategy for the Broadening Triangle Pattern
Entry
Enter a trade only after a confirmed breakout:
- Buy when the price closes above the upper trendline.
- Sell when the price closes below the lower trendline.
Some traders prefer waiting for a retest of the broken trendline for additional confirmation.
Stop Loss
Place the stop loss:
- Below the breakout candle for bullish trades.
- Above the breakout candle for bearish trades.
- Alternatively, beyond the opposite side of the pattern.
Profit Target
Measure the maximum height of the Broadening Triangle and project that distance from the breakout point to estimate a potential target.
Example
Imagine a stock trading between ₹900 and ₹950.
Instead of narrowing, each rally reaches a new high while each decline falls to a new low. The trendlines move farther apart, forming a Broadening Triangle.
Eventually, the price breaks above the upper trendline with strong trading volume. A trader enters a buy trade, places a stop loss below the breakout level, and sets a target based on the height of the pattern.
Advantages of the Broadening Triangle Pattern
- Works across multiple financial markets.
- Identifies periods of high volatility.
- Suitable for breakout trading.
- Provides clear entry and exit levels.
- Can be used on different timeframes.
- Offers strong profit potential when confirmed.
Disadvantages of the Broadening Triangle Pattern
- False breakouts can occur.
- Difficult for beginners to identify correctly.
- Requires patience and confirmation.
- Increased volatility raises trading risk.
- Not every pattern leads to a successful breakout.
Common Mistakes to Avoid
Many traders make these mistakes:
- Entering before the breakout.
- Ignoring the overall market trend.
- Drawing incorrect trendlines.
- Trading without volume confirmation.
- Placing stop losses too close.
- Risking too much on a single trade.
Avoiding these errors can improve long-term trading performance.
Tips for Better Trading
- Wait for a candle close outside the pattern.
- Confirm the breakout with higher trading volume.
- Use indicators like RSI, MACD, or Moving Averages for additional confirmation.
- Follow proper risk management.
- Avoid emotional trading during periods of high volatility.
- Never risk more than 1–2% of your trading capital on a single trade.
- Practice identifying the pattern on historical charts before using it in live markets.
Conclusion
The Broadening Triangle Pattern is a unique chart pattern that reflects increasing volatility and market uncertainty. While the expanding price swings may seem unpredictable, waiting for a confirmed breakout can provide high-quality trading opportunities.
By combining the Broadening Triangle with volume analysis, trend confirmation, and disciplined risk management, traders can make more informed decisions and reduce the impact of false signals. Consistent practice and patience are essential for mastering this powerful technical analysis pattern.
Frequently Asked Questions (FAQs)
1. Is the Broadening Triangle bullish or bearish?
It can be either. The breakout direction determines whether the pattern becomes bullish or bearish.
2. Why is it called a Megaphone Pattern?
Because the diverging trendlines resemble the shape of a megaphone, with the pattern becoming wider over time.
3. Which markets does the Broadening Triangle work in?
It can be used in stocks, forex, cryptocurrencies, commodities, and indices.
4. Is volume important?
Yes. Strong volume during the breakout generally increases the reliability of the trading signal.
5. Which indicators work well with this pattern?
Many traders combine the Broadening Triangle with RSI, MACD, Moving Averages, Bollinger Bands, and Volume indicators for additional confirmation.
6. Can the Broadening Triangle fail?
Yes. Like all chart patterns, false breakouts are possible. Using stop losses and proper risk management helps protect trading capital.