
Introduction
Candlestick patterns are among the most powerful tools used in technical analysis. They help traders understand market sentiment and predict potential price movements. One of the most important bullish reversal candlestick patterns is the Hammer Candle. This pattern is widely used by traders and investors to identify possible trend reversals after a downtrend. Understanding the Hammer candle can help beginners make better trading decisions and improve their chart-reading skills. In this article, you will learn what a Hammer candle is, how to identify it, why it forms, and how traders use it in the stock market.
What is a Hammer Candle?
A Hammer candle is a single candlestick pattern that usually appears after a downtrend and signals a potential bullish reversal. It gets its name because its shape resembles a hammer.
The Hammer candle indicates that sellers initially pushed prices significantly lower during the trading session, but buyers stepped in and pushed the price back up before the market closed.
This shows that buying pressure is increasing and selling pressure may be weakening.
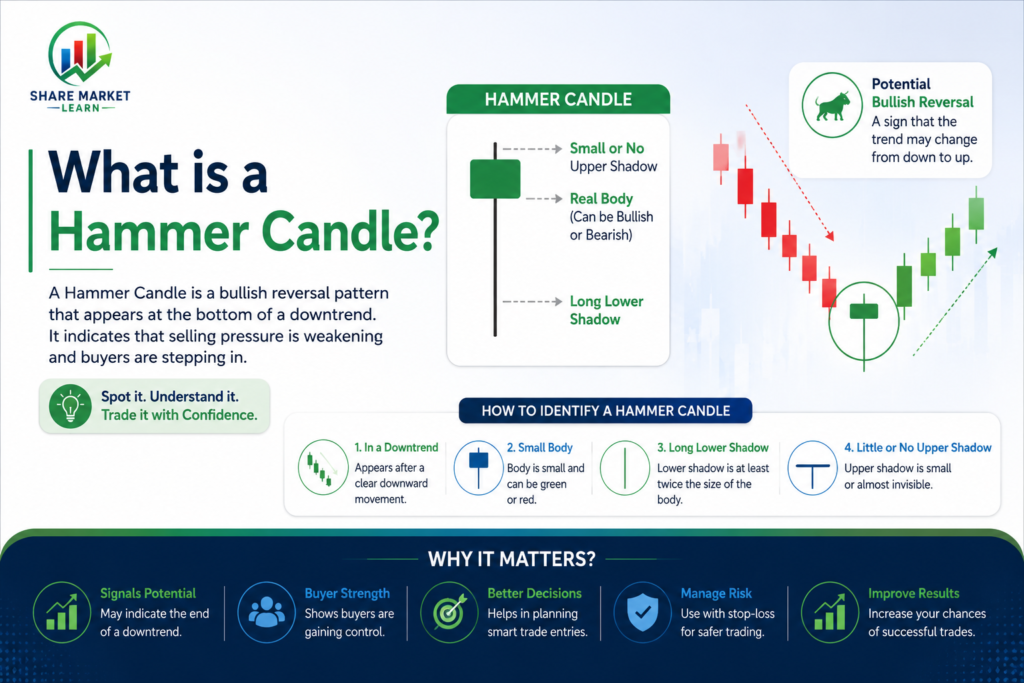
Structure of a Hammer Candle
A Hammer candle has a unique structure that makes it easy to identify.
Small Real Body
The candle has a small body near the top of the trading range.
Long Lower Shadow
The lower shadow should be at least twice the size of the real body.
Little or No Upper Shadow
The upper shadow is either very small or completely absent.
Color of the Candle
The candle can be green or red, although a green Hammer is generally considered stronger.
The most important feature is the long lower shadow, which shows rejection of lower prices.
How to Identify a Hammer Candle?
To identify a Hammer candle on a chart, look for these characteristics:
- Appears after a downtrend.
- Small body near the top of the candle.
- Long lower wick.
- Very small or no upper wick.
- Indicates strong buying pressure after initial selling.
When all these conditions are present, the candle is considered a Hammer pattern.
Why Does a Hammer Candle Form?
Understanding the psychology behind the Hammer candle is important.
Step 1: Sellers Take Control
At the beginning of the session, sellers push the stock price lower.
Step 2: Buyers Enter the Market
As prices decline, buyers see value and begin purchasing shares.
Step 3: Strong Recovery
Buyers continue buying and push the stock price back toward the opening level.
Step 4: Market Closes Near the High
The stock closes near its opening price or session high.
This behavior indicates that buyers are becoming stronger and may soon take control of the trend.
Hammer Candle Example
Suppose a stock opens at ₹100.
During the day, sellers push the price down to ₹85.
Later, buyers enter aggressively and push the stock back to ₹99 before the market closes.
In this case:
- Open = ₹100
- Low = ₹85
- Close = ₹99
The resulting candlestick would resemble a Hammer because it has a long lower shadow and a small body near the top.
Hammer vs Hanging Man
Many beginners confuse the Hammer candle with the Hanging Man candle because both have similar shapes.
Hammer Candle
- Appears after a downtrend.
- Indicates a potential bullish reversal.
- Suggests buying strength.
Hanging Man Candle
- Appears after an uptrend.
- Indicates a potential bearish reversal.
- Suggests weakening buying momentum.
The location of the candle is what determines its meaning.
Importance of Trend Before Hammer Formation
The Hammer pattern is most effective when it appears after a noticeable downtrend.
If a Hammer forms during a sideways market, the signal becomes less reliable.
A proper downtrend before the Hammer increases the probability of a successful bullish reversal.
Confirmation is Important
One of the biggest mistakes traders make is buying immediately after seeing a Hammer candle.
The Hammer only suggests a possible reversal.
Confirmation is necessary before entering a trade.
Bullish Confirmation
- A strong green candle forms after the Hammer.
- Price breaks above the Hammer high.
- Trading volume increases.
These signals provide additional confidence that buyers are taking control.
Hammer Candle and Volume
Volume plays a crucial role in confirming Hammer patterns.
High Volume Hammer
A Hammer accompanied by high trading volume is generally considered stronger.
Low Volume Hammer
A Hammer with low volume may be less reliable because it indicates weaker buying interest.
Many traders prefer Hammer patterns supported by above-average volume.
Using Hammer Candle with Support Levels
Hammer candles become more effective when they appear near important support zones.
Why Support Matters
Support levels are areas where buying interest has historically been strong.
When a Hammer forms near support:
- Buyers defend the support level.
- Selling pressure weakens.
- Reversal probability increases.
This combination often attracts the attention of technical traders.
Using Hammer Candle with Moving Averages
Moving averages help traders identify trend direction.
A Hammer forming near a major moving average can strengthen the reversal signal.
Popular moving averages include:
- 20-Day Moving Average
- 50-Day Moving Average
- 200-Day Moving Average
Combining Hammer candles with moving averages can improve trade accuracy.
Advantages of Hammer Candle
Easy to Identify
The Hammer has a distinctive shape that beginners can quickly recognize.
Early Reversal Signal
It may help traders identify trend reversals before major price moves occur.
Works in Multiple Markets
Hammer patterns can be used in stocks, commodities, forex, and cryptocurrencies.
Useful with Technical Indicators
It works well alongside RSI, moving averages, and support-resistance analysis.
Limitations of Hammer Candle
Not a Guaranteed Reversal
A Hammer does not always lead to an upward move.
Requires Confirmation
Without confirmation, false signals may occur.
Less Effective in Sideways Markets
The pattern performs better after a clear downtrend.
Market Conditions Matter
External news and market sentiment can override technical patterns.
Common Mistakes Beginners Make
Ignoring the Trend
A Hammer is most effective after a downtrend.
Trading Without Confirmation
Entering a trade before confirmation increases risk.
Ignoring Volume
Volume helps determine the strength of the signal.
Not Using Stop-Loss
Every trade should have proper risk management.
Relying Only on One Pattern
Combining Hammer candles with other indicators provides better results.
Tips for Beginners
- Always identify the existing trend first.
- Wait for a confirmation candle before entering a trade.
- Use support and resistance levels.
- Monitor trading volume.
- Combine Hammer patterns with technical indicators.
- Follow proper risk management.
- Practice identifying Hammer candles on historical charts.
Conclusion
The Hammer candle is one of the most important bullish reversal candlestick patterns in technical analysis. It appears after a downtrend and signals that buyers may be gaining control of the market. The pattern is identified by a small body near the top of the candle and a long lower shadow that is at least twice the size of the body. While the Hammer can provide valuable clues about potential market reversals, it should not be used alone. Traders should always look for confirmation, analyze volume, and combine the pattern with support levels and technical indicators. For beginners, learning to identify and understand the Hammer candle is an excellent step toward becoming a more confident and successful trader.