Introduction
Candlestick patterns are among the most important tools used in technical analysis. Traders use these patterns to understand market sentiment and predict possible future price movements. One of the most popular and widely recognized candlestick patterns is the Doji Candle. Whether you are a beginner or an experienced trader, understanding the Doji candle can help you make better trading decisions. The Doji candle often signals indecision in the market and may indicate a potential trend reversal or continuation depending on where it appears. In this article, you will learn what a Doji candle is, how to identify it, its types, and how traders use it in the stock market.
What is a Doji Candle?
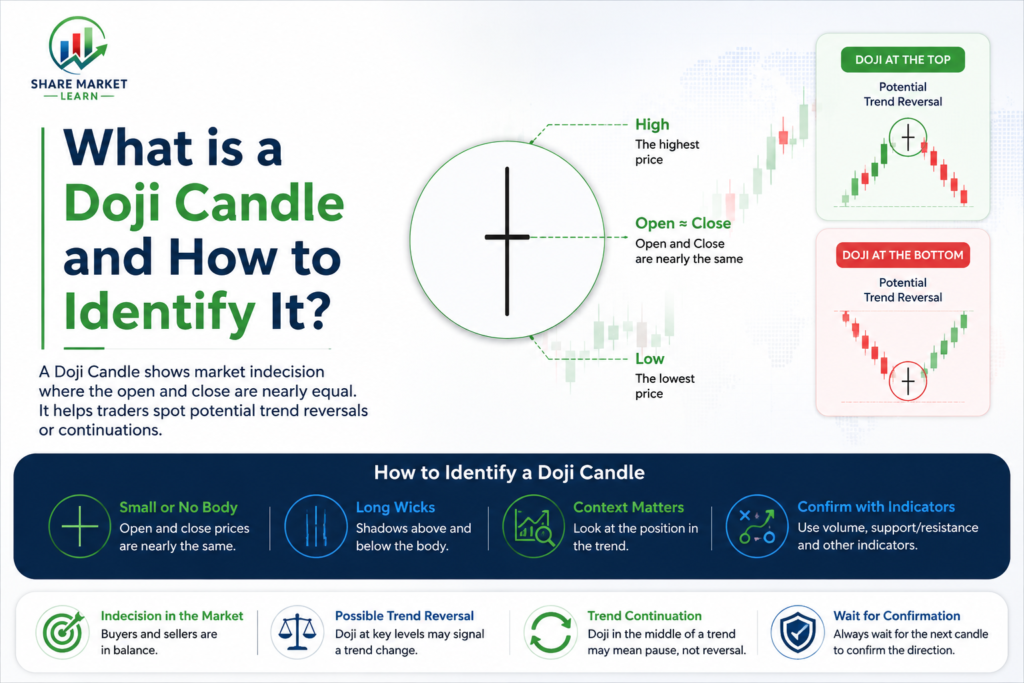
A Doji candle is a candlestick pattern where the opening price and closing price are almost the same or exactly the same. Because the opening and closing prices are very close, the candle has a very small body or sometimes appears as a thin horizontal line.
A Doji candle represents a battle between buyers and sellers where neither side gains complete control. It indicates uncertainty and indecision in the market.
During the trading session, prices may move up and down significantly, but by the end of the session, the price closes near the opening level.
Structure of a Doji Candle
A Doji candle consists of:
Small or No Real Body
The opening and closing prices are nearly identical.
Upper Shadow
Shows the highest price reached during the session.
Lower Shadow
Shows the lowest price reached during the session.
The size of the shadows can vary depending on the type of Doji candle.
How to Identify a Doji Candle?
Identifying a Doji candle is relatively simple.
Look for the following characteristics:
- Opening price and closing price are almost equal.
- The candle body is extremely small.
- The candle may have upper and lower shadows.
- It often appears after a strong uptrend or downtrend.
When viewed on a chart, a Doji resembles a plus sign (+), cross, or inverted cross.
Why is a Doji Candle Important?
The Doji candle is important because it indicates market indecision.
It tells traders that:
- Buyers and sellers are evenly matched.
- The current trend may be weakening.
- A potential reversal could occur.
- Traders should wait for confirmation before entering a trade.
The significance of a Doji depends heavily on where it appears in the chart.
Types of Doji Candles
Standard Doji
This is the most common Doji pattern.
Characteristics:
- Small body in the center.
- Upper and lower shadows are nearly equal.
- Indicates balance between buyers and sellers.
Long-Legged Doji
This type has very long upper and lower shadows.
Characteristics:
- Large price movement during the session.
- Open and close remain close together.
- Indicates strong market uncertainty.
The longer the shadows, the greater the market indecision.
Dragonfly Doji
The Dragonfly Doji has a long lower shadow and little or no upper shadow.
Characteristics:
- Open, high, and close prices are nearly the same.
- Sellers pushed prices lower during the session.
- Buyers regained control and pushed prices back up.
This pattern can indicate a bullish reversal when it appears after a downtrend.
Gravestone Doji
The Gravestone Doji has a long upper shadow and little or no lower shadow.
Characteristics:
- Open, low, and close prices are nearly the same.
- Buyers pushed prices higher initially.
- Sellers took control and forced prices back down.
This pattern may signal a bearish reversal when found after an uptrend.
Four Price Doji
This is a rare Doji pattern.
Characteristics:
- Open, high, low, and close prices are the same.
- Appears as a straight horizontal line.
- Indicates extremely low market activity.
This pattern is rarely seen in highly traded stocks.
Doji Candle in an Uptrend
When a Doji appears after a strong uptrend, it may indicate that buyers are losing momentum.
For example:
- Stock price has been rising continuously.
- A Doji candle appears near resistance.
- Buyers and sellers become balanced.
- Trend reversal becomes possible.
However, traders should always wait for confirmation from the next candle before taking action.
Doji Candle in a Downtrend
When a Doji appears after a strong downtrend, it may signal that selling pressure is weakening.
For example:
- Stock price has been falling steadily.
- A Doji candle forms near support.
- Sellers lose control.
- Buyers begin entering the market.
This can indicate a potential bullish reversal.
Confirmation is Important
One of the biggest mistakes beginners make is trading solely based on a Doji candle.
A Doji only indicates uncertainty, not a guaranteed reversal.
Always look for confirmation from the next candle.
Bullish Confirmation
- A strong green candle forms after the Doji.
- Trading volume increases.
- Price breaks resistance levels.
Bearish Confirmation
- A strong red candle forms after the Doji.
- Selling volume increases.
- Price breaks support levels.
Combining Doji with Other Indicators
Professional traders rarely use a Doji candle alone.
They combine it with other technical indicators for better accuracy.
Moving Averages
A Doji near major moving averages can provide stronger signals.
Support and Resistance
A Doji appearing at important support or resistance levels is often more reliable.
RSI (Relative Strength Index)
If RSI shows overbought or oversold conditions along with a Doji, the reversal signal becomes stronger.
Volume Analysis
Higher trading volume during a Doji formation often increases its significance.
Advantages of Using Doji Candles
Easy to Identify
Even beginners can quickly recognize Doji patterns on charts.
Works in All Markets
Doji candles can be used in stocks, commodities, forex, and cryptocurrencies.
Helps Detect Reversals
They often appear before major trend changes.
Useful with Other Indicators
Doji candles work well when combined with technical analysis tools.
Limitations of Doji Candles
Not Always a Reversal Signal
A Doji may simply indicate temporary consolidation.
Requires Confirmation
Trading without confirmation can lead to false signals.
Less Reliable in Sideways Markets
Doji candles frequently appear in range-bound markets without producing meaningful moves.
Should Not Be Used Alone
Combining Doji patterns with other indicators improves decision-making.
Tips for Beginners
- Learn to identify all major Doji variations.
- Always analyze the overall market trend.
- Use confirmation candles before entering trades.
- Combine Doji candles with support and resistance levels.
- Apply stop-loss orders to manage risk.
- Practice identifying Doji patterns on historical charts.
- Avoid making trading decisions based solely on one candlestick pattern.
Conclusion
The Doji candle is one of the most important candlestick patterns in technical analysis. It represents indecision between buyers and sellers and often appears before significant market movements. By learning how to identify different types of Doji candles such as the Standard Doji, Dragonfly Doji, Gravestone Doji, and Long-Legged Doji, traders can better understand market sentiment and potential trend changes. However, a Doji should never be used alone. Combining it with confirmation candles, volume analysis, support and resistance levels, and technical indicators can significantly improve trading accuracy. For beginners, mastering the Doji candle is an excellent step toward understanding chart patterns and becoming a more confident trader.