
The Hanging Man candle is one of the most popular candlestick patterns used in technical analysis. Traders often watch for it because it can provide an early warning that an ongoing uptrend may be losing strength.
If you are new to candlestick patterns, the Hanging Man may look confusing at first. Its shape is actually quite simple: it has a small real body near the top of the candle and a long lower shadow. The important point is where this candle appears—ideally after a price rise.
In this article, we will understand what a Hanging Man candle is, how to identify it, what it means, how traders use it, and some common mistakes beginners should avoid.
What Is a Hanging Man Candle?
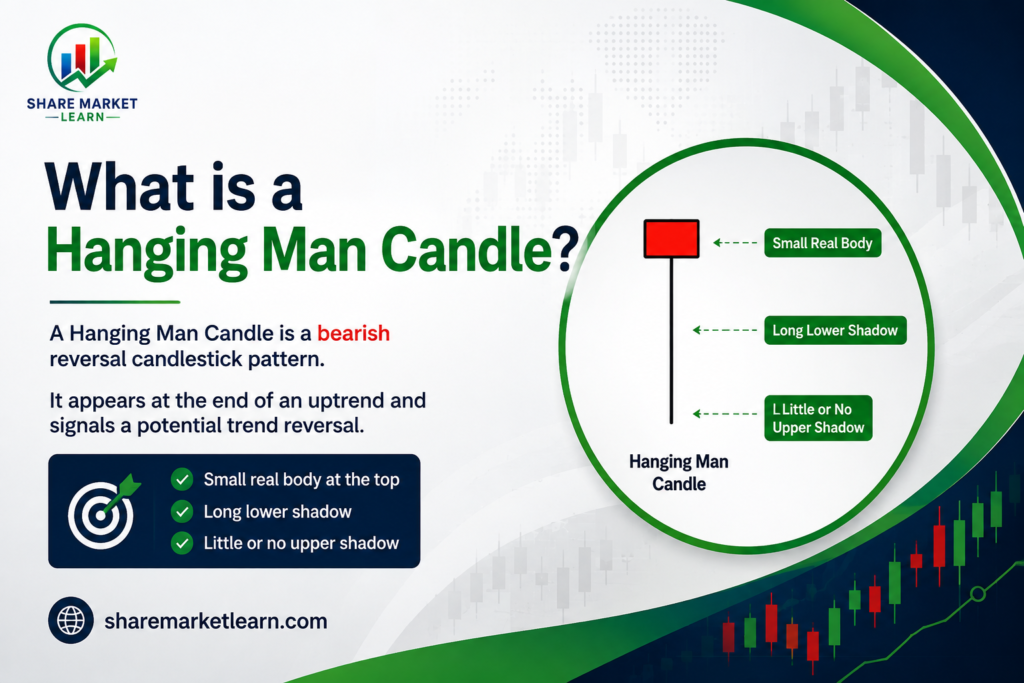
A Hanging Man candle is a bearish reversal candlestick pattern that usually appears after an uptrend.
It has:
- A small real body near the top of the candle
- A long lower wick or shadow
- Little or no upper shadow
- A position near the top of an existing price move
The candle can be either green or red. However, a red or bearish Hanging Man can provide a stronger warning because it shows that sellers were able to push the price below the opening level.
The key idea is simple: buyers were controlling the trend, but sellers suddenly showed significant strength during the trading session.
How Does a Hanging Man Candle Form?
To understand the pattern, imagine a stock that has been moving higher for several days.
During one trading session, the price opens near the upper part of the range. Sellers then enter aggressively and push the price much lower. Later, buyers recover much of the decline, bringing the closing price back near the opening price.
The result is a candle with:
Small body + long lower shadow + little upper shadow
This tells traders that although buyers managed to recover the price, sellers were strong enough to create a significant intraday decline.
That is why the Hanging Man can act as a warning sign.
What Does the Hanging Man Candle Indicate?
The Hanging Man does not automatically mean that the price will fall.
Instead, it suggests that the current uptrend may be becoming weaker.
The long lower shadow shows that sellers were able to push the price down significantly during the session. If similar selling pressure continues in the next few candles, the market may experience a bearish reversal.
Therefore, traders usually wait for confirmation instead of selling immediately when they see a Hanging Man.
Hanging Man vs Hammer: What Is the Difference?
One of the most common questions beginners ask is:
“Is a Hanging Man the same as a Hammer?”
The candle shape can look almost identical, but the market context is different.
Hammer
A Hammer usually appears after a downtrend.
It can indicate that sellers are losing control and buyers may start pushing the price upward.
Hanging Man
A Hanging Man usually appears after an uptrend.
It can indicate that buyers may be losing control and sellers could become stronger.
So remember:
Hammer = after a downtrend
Hanging Man = after an uptrend
The same basic candle shape can have a different meaning depending on where it appears on the chart.
Key Characteristics of a Hanging Man
For beginners, these are the most important characteristics to remember:
1. It Appears After an Uptrend
The surrounding price action is extremely important.
A candle with the same shape appearing in a sideways or downward market should not automatically be called a Hanging Man.
2. Small Real Body
The opening and closing prices should be relatively close together.
This indicates that buyers and sellers finished the session near each other.
3. Long Lower Shadow
The lower wick is the most noticeable feature.
Ideally, the lower shadow should be at least around twice the size of the real body.
4. Small or No Upper Shadow
The candle generally has a very small upper wick or no upper wick.
5. Confirmation Is Important
The next candle can provide additional information.
A strong bearish candle following the Hanging Man may increase confidence that sellers are taking control.
How to Trade a Hanging Man Candle
There is no single perfect strategy for trading the Hanging Man. However, beginners can use a simple confirmation-based approach.
Step 1: Identify an Uptrend
First, look for a clear upward price movement.
You can identify an uptrend by looking for higher highs and higher lows.
Step 2: Find the Hanging Man
Look for a candle with a small body and a long lower shadow near the top of the trend.
Step 3: Wait for Confirmation
Instead of immediately entering a trade, wait for the next candle.
A bearish candle that moves below the Hanging Man’s low can provide stronger confirmation of potential weakness.
Step 4: Consider Risk Management
If a trader decides to take a bearish position, they should have a predefined risk-management plan.
A stop-loss may be placed above an appropriate recent swing high, depending on the trading strategy and market conditions.
Step 5: Look for Additional Evidence
The Hanging Man becomes more useful when combined with other technical tools.
For example:
- Resistance levels
- Trendlines
- Support and resistance
- Moving averages
- RSI
- Trading volume
- Other bearish candlestick patterns
No single indicator should be treated as a guaranteed prediction.
Example of a Hanging Man
Suppose a stock has moved from ₹100 to ₹130 over several trading sessions.
At ₹130, a candle forms with:
- Open: ₹128
- High: ₹131
- Low: ₹118
- Close: ₹129
The candle has a small body around ₹128–₹129 and a long lower shadow extending toward ₹118.
This could qualify as a Hanging Man if it appears after a meaningful uptrend.
However, the pattern alone does not guarantee a decline.
If the next candle breaks below the Hanging Man’s low and selling volume increases, traders may see stronger evidence of bearish pressure.
Hanging Man and Trading Volume
Volume can provide additional context.
If a Hanging Man appears with higher-than-usual trading volume, it may indicate that more market participants were active during the session.
However, high volume does not automatically mean the price must fall.
Traders should combine volume with price action and the overall market structure.
Common Mistakes Beginners Make
Mistake 1: Trading Every Hanging Man
Not every candle with a long lower wick is a reliable Hanging Man.
The pattern’s location and market trend matter.
Mistake 2: Ignoring Confirmation
Selling immediately after seeing the pattern can lead to false signals.
Waiting for confirmation can help reduce unnecessary trades.
Mistake 3: Ignoring Support Levels
If a Hanging Man forms directly above strong support, the price may find buying pressure instead of reversing.
Always check the surrounding chart.
Mistake 4: Using Only One Indicator
Candlestick patterns work better when combined with other forms of analysis.
Avoid making trading decisions based on a single candle alone.
Mistake 5: Forgetting Risk Management
Even a high-quality-looking setup can fail.
Always consider your entry, stop-loss, position size, and potential reward before taking a trade.
Is the Hanging Man a Strong Reversal Pattern?
The Hanging Man is best considered a warning signal rather than a guaranteed reversal signal.
Its reliability can improve when several factors support the bearish idea.
For example:
Uptrend + Hanging Man + resistance + high volume + bearish confirmation
can provide a stronger setup than a Hanging Man appearing alone.
Still, financial markets are unpredictable, and no candlestick pattern can guarantee future price movement.
Final Thoughts
The Hanging Man candle is a useful candlestick pattern for understanding possible weakness near the end of an uptrend.
Its appearance tells traders that sellers were able to push the price significantly lower during the session, even though buyers recovered much of the decline before the close.
The most important thing to remember is that context matters.
Do not simply look for the candle’s shape. First identify the trend, then examine support and resistance, volume, and confirmation from subsequent price action.
For beginners, a simple rule is:
“Hanging Man after an uptrend = possible bearish warning. Wait for confirmation before making a trading decision.”
With practice, you can learn to recognize the pattern more confidently and understand how it fits into a broader technical-analysis strategy.
Frequently Asked Questions
1. What is a Hanging Man candle?
A Hanging Man is a candlestick pattern that usually appears after an uptrend. It has a small body near the top and a long lower shadow, potentially warning of bearish pressure.
2. Is a Hanging Man bullish or bearish?
The Hanging Man is generally considered a bearish reversal warning pattern, particularly when it appears after a strong uptrend.
3. What is the difference between a Hammer and a Hanging Man?
The main difference is the market context. A Hammer generally appears after a downtrend, while a Hanging Man generally appears after an uptrend.
4. Should I sell immediately after a Hanging Man?
Not necessarily. Many traders wait for bearish confirmation from the next candle or other technical indicators before making a decision.
5. Does the Hanging Man always predict a market fall?
No. Candlestick patterns are not guaranteed predictions. A Hanging Man can fail, which is why confirmation and risk management are important.
6. Can the Hanging Man be used for intraday trading?
Yes. Traders can use candlestick patterns on intraday charts, but the reliability of a signal depends on the timeframe, market conditions, liquidity, and other technical factors.
7. Is a red Hanging Man stronger than a green Hanging Man?
A red Hanging Man may provide a somewhat stronger bearish indication because the closing price is below the opening price. However, the overall chart context remains more important than candle color alone.
8. Which indicators can be combined with the Hanging Man?
Traders may consider support and resistance, moving averages, RSI, trendlines, volume, and other price-action signals to obtain additional confirmation.