
When traders look at a chart, they often want answers to a few basic questions: What is the current trend? Where could price reverse? Where is liquidity located? Are buyers or sellers in control?
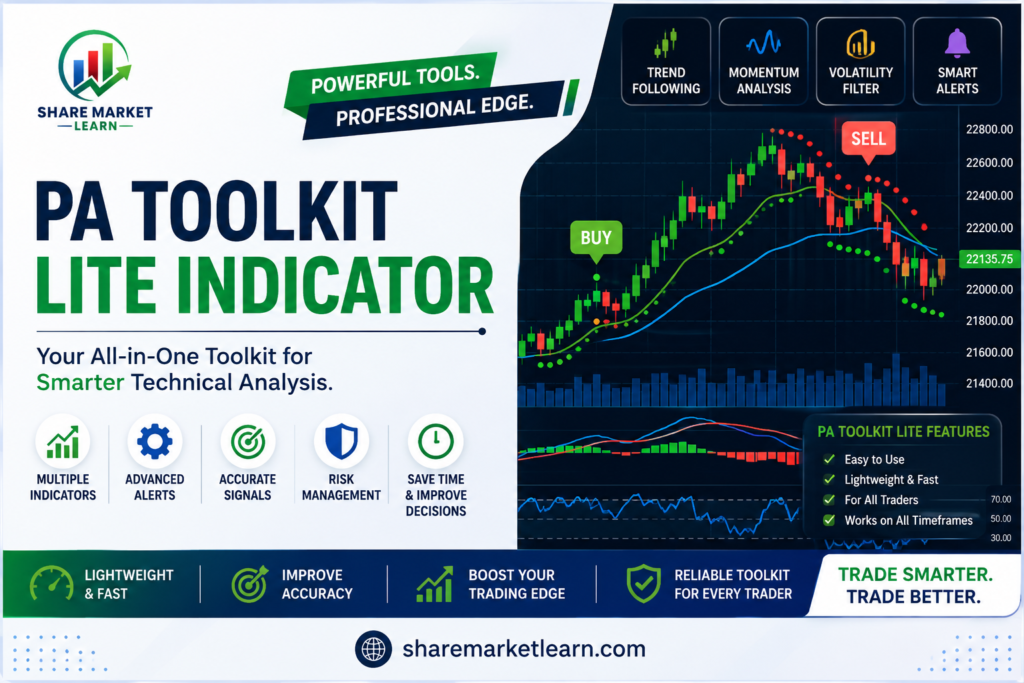
The PA Toolkit Lite Indicator is designed to bring several price-action concepts together on one chart. Instead of relying on a single moving average or oscillator, it can help traders visualize elements such as market structure, liquidity sweeps, order blocks, and trend lines.
The version commonly known as Price Action Toolkit Lite [UAlgo] includes options for market structure, liquidity sweeps, order blocks, and automatically detected trend lines. Its published Pine Script also allows traders to adjust settings such as ZigZag length, liquidity length, the number of order blocks displayed, and trend-line sensitivity.
In this beginner-friendly guide, we will explain what the PA Toolkit Lite Indicator is, how its major features work, how traders can use it, its advantages and limitations, and how to build a simple price-action trading approach around it.
What Is the PA Toolkit Lite Indicator?
PA Toolkit Lite is a price-action analysis indicator designed to help traders study important market behavior directly on a price chart.
The term PA stands for Price Action. Price action focuses mainly on how price moves rather than depending entirely on traditional indicators.
The toolkit brings several concepts together, including:
- Market structure
- Liquidity sweeps
- Order blocks
- Trend lines
- Potential breakouts and reversals
This can make chart analysis easier because traders do not necessarily need to add several separate tools to identify these concepts.
It is important to understand that PA Toolkit Lite is an analysis tool, not a guarantee of profitable trades. The indicator can highlight areas of interest, but the trader still needs to make the final decision.
Main Features of PA Toolkit Lite
The biggest attraction of the PA Toolkit Lite Indicator is that it combines multiple price-action concepts.
Let’s look at each feature in simple language.
1. Market Structure
Market structure is one of the most important ideas in price-action trading.
A market generally creates a sequence of:
- Higher highs
- Higher lows
- Lower highs
- Lower lows
An uptrend typically develops through higher highs and higher lows, while a downtrend tends to create lower highs and lower lows.
PA Toolkit Lite can use a ZigZag-based approach to help visualize market structure. The published script includes a Show Market Structure option and a configurable ZigZag Length setting.
Why Market Structure Matters
Understanding market structure can help answer a simple question:
Is the market currently moving upward, downward, or sideways?
For example:
Higher High + Higher Low → Potential bullish structure
Lower High + Lower Low → Potential bearish structure
However, traders should not assume that every new high or low represents a major trend change. Context is important.
2. Liquidity Sweeps
Liquidity is another important concept used in modern price-action and Smart Money Concepts (SMC) trading.
Liquidity can build around obvious areas such as:
- Previous highs
- Previous lows
- Equal highs
- Equal lows
- Major support levels
- Major resistance levels
A liquidity sweep occurs when price moves through an important level and then reverses or reacts strongly.
For example, imagine a stock has formed a clear previous high. Many traders may place stop-loss orders around that area.
Price moves above the previous high, triggers those orders, and then falls back below the level.
This can be interpreted as a potential liquidity sweep.
PA Toolkit Lite includes a liquidity-sweep feature and allows the user to adjust its liquidity-length setting.
How Traders Can Use Liquidity Sweeps
A liquidity sweep should generally be treated as an area of interest, not an automatic buy or sell signal.
A trader may wait for additional confirmation such as:
- A strong reversal candle
- A market-structure change
- Break of a nearby swing level
- Reaction from an order block
- Confirmation from a higher timeframe
This can help reduce the risk of entering simply because price briefly crossed a previous high or low.
3. Order Blocks
Order blocks are another major component of the PA Toolkit Lite Indicator.
In price-action and SMC-style trading, an order block is generally viewed as an important price area associated with a significant move.
Traders often watch these zones because price may react when it returns to them.
PA Toolkit Lite includes an option to display order blocks and allows users to control how many order blocks are shown on the chart. The published script includes a setting for the number of order blocks, with a configurable range.
Bullish Order Block
A bullish order block is commonly associated with an area from which price makes a strong upward move.
Traders may watch the zone for potential support if price returns to it.
Bearish Order Block
A bearish order block is commonly associated with an area from which price makes a strong downward move.
Traders may watch it as a potential resistance area when price revisits it.
However, an order block should not automatically be considered a guaranteed reversal zone.
4. Trend Lines
Trend lines are one of the oldest and simplest technical analysis tools.
PA Toolkit Lite can automatically detect and display trend lines. Its settings include an option to show trend lines and a Trend Line Detection Sensitivity setting.
A rising trend line can help traders visualize potential support.
A falling trend line can help visualize potential resistance.
When price breaks a trend line, traders may watch for confirmation that market conditions are changing.
Example
Suppose a stock has been making higher lows while respecting a rising trend line.
If price suddenly breaks below the trend line and also breaks an important swing low, the combination may suggest that bullish momentum is weakening.
This is generally more useful than looking at a trend-line break by itself.
How to Use PA Toolkit Lite
The best way to use the indicator is to treat it as a chart-analysis framework rather than a simple buy/sell signal generator.
Here is a basic process beginners can follow.
Step 1: Identify the Higher-Timeframe Trend
Before looking for an entry, check the larger timeframe.
For example:
- Daily chart for the broader trend
- 1-hour chart for intermediate structure
- 15-minute chart for an intraday setup
If the higher timeframe is strongly bullish, traders may focus more attention on bullish setups.
If the higher timeframe is bearish, bearish opportunities may receive more attention.
Step 2: Study Market Structure
Look for:
- Higher highs
- Higher lows
- Lower highs
- Lower lows
- Breaks of important swing points
This helps establish the current market direction.
Step 3: Identify Liquidity
Look around recent highs and lows.
Ask:
Where are traders likely to place stop-loss orders?
These areas can become potential liquidity zones.
If price sweeps one of these levels and quickly returns, traders may watch for additional confirmation.
Step 4: Check Order Blocks
After identifying a potential liquidity sweep, check whether price is reacting around an order block.
A combination such as:
Liquidity Sweep + Order Block + Structure Confirmation
may provide stronger context than any single feature alone.
Step 5: Look for Confirmation
Before entering a trade, traders can wait for confirmation.
Possible confirmation signals include:
- Break of structure
- Strong rejection candle
- Change in market structure
- Trend-line breakout
- Higher-timeframe alignment
This approach helps avoid entering trades too early.
PA Toolkit Lite for Intraday Trading
PA Toolkit Lite can be useful for intraday traders who want to analyze price structure without filling the chart with many separate indicators.
For example, an intraday trader may use:
1-hour chart → Identify broader direction
15-minute chart → Identify market structure
5-minute chart → Look for entry confirmation
The exact timeframes should depend on the trader’s strategy.
Shorter timeframes can produce more signals but also contain more market noise.
PA Toolkit Lite for Swing Trading
Swing traders can also use price-action concepts from the toolkit.
A swing trader may start with a daily or 4-hour chart and identify:
- Major market structure
- Important liquidity levels
- Large order blocks
- Trend lines
- Potential breakout areas
Then, a lower timeframe can be used to look for an entry.
This multi-timeframe approach can provide more context than relying on a single chart.
Example of a Simple PA Toolkit Strategy
Here is an educational example of how a trader could structure a setup.
Bullish Example
- Higher timeframe shows an uptrend.
- Price creates a previous low.
- Price moves below that low and sweeps liquidity.
- Price returns above the level.
- A bullish market-structure change occurs.
- Price reacts from a bullish order block.
- The trader waits for confirmation before entering.
- Stop-loss is placed according to the trader’s risk-management rules.
- A logical resistance or liquidity area can be considered as a potential target.
Notice that the setup does not depend on one signal.
It combines trend + liquidity + structure + order block + confirmation.
Example of a Bearish Setup
A bearish setup could work in the opposite direction.
- Higher timeframe shows a downtrend.
- Price approaches a previous high.
- Price moves above the high and sweeps liquidity.
- Price falls back below the level.
- Bearish market structure develops.
- Price reacts near a bearish order block.
- The trader waits for confirmation.
- Risk is controlled with an appropriate stop-loss.
- A lower liquidity area or support zone may become a potential target.
Again, this is an educational framework rather than a guaranteed trading strategy.
Advantages of PA Toolkit Lite
Multiple Price-Action Tools in One Place
Instead of adding several separate indicators, traders can analyze multiple concepts from one toolkit.
Useful for Beginners
The visual presentation can make concepts such as structure, liquidity, and order blocks easier to study.
Customizable
The indicator includes settings that allow traders to change aspects such as ZigZag length, liquidity length, order-block display, and trend-line sensitivity.
Helps Organize Chart Analysis
A structured chart can make it easier to identify important areas before making a trading decision.
Useful Across Different Trading Styles
The concepts can be applied to intraday trading, swing trading, and broader market analysis.
Limitations of PA Toolkit Lite
No indicator is perfect, and PA Toolkit Lite has limitations.
It Can Create Chart Clutter
When many features are enabled at the same time, the chart can become difficult to read.
Beginners may be better off starting with only the features they understand.
Signals Can Be False
A liquidity sweep does not always lead to a reversal.
An order block does not always hold.
A trend line does not always produce a successful breakout.
Markets can behave unpredictably.
Market Structure Can Be Subjective
Different traders may interpret swing highs, swing lows, and structural breaks differently.
It Does Not Guarantee Profits
The indicator is designed to assist analysis. It cannot predict the future or guarantee successful trades.
Risk Management Is Still Essential
Even a high-quality setup can fail.
Traders should always consider position sizing, stop-loss placement, risk-reward ratio, and overall account risk.
Common Mistakes Beginners Should Avoid
Using Every Signal
Not every liquidity sweep or order block deserves a trade.
Ignoring the Higher Timeframe
A lower-timeframe setup can fail when it goes strongly against the broader market direction.
Adding Too Many Indicators
The purpose of a toolkit is to simplify analysis. Adding ten more indicators can make the chart confusing.
Entering Too Early
Waiting for confirmation can sometimes provide a more disciplined approach.
Risking Too Much
No setup is guaranteed. A trader should never risk an amount they cannot afford to lose.
PA Toolkit Lite vs Traditional Indicators
Traditional indicators such as RSI, MACD, moving averages, and Stochastic focus on mathematical calculations derived from price and sometimes volume.
PA Toolkit Lite focuses more directly on price structure and chart-based concepts.
This does not mean one approach is automatically better.
For example:
PA Toolkit Lite → Structure, liquidity, order blocks, trend lines
RSI → Momentum
Moving Average → Trend filtering
MACD → Trend and momentum
Some traders combine these approaches to create a broader analytical framework.
Tips for Beginners
If you are just starting with PA Toolkit Lite, keep things simple.
- Learn market structure first.
- Understand liquidity before trading liquidity sweeps.
- Study order blocks on historical charts.
- Start with a clean chart.
- Use a higher timeframe for context.
- Wait for confirmation.
- Backtest your strategy.
- Keep risk small.
- Maintain a trading journal.
- Never assume an indicator guarantees a winning trade.
The goal should be to understand why a setup may work rather than simply following labels on the chart.
Conclusion
The PA Toolkit Lite Indicator can be a useful tool for traders who want to study price action in a more organized way. By bringing together market structure, liquidity sweeps, order blocks, and trend lines, it can help traders identify areas that deserve closer attention.
Its real value comes from combining these concepts logically rather than treating every visual signal as a trade opportunity.
A beginner can start by identifying the higher-timeframe trend, studying market structure, locating liquidity, watching important order blocks, and waiting for confirmation before considering a trade.
Remember that no indicator can predict the market with certainty. PA Toolkit Lite should be treated as an analysis and decision-support tool, alongside proper risk management, backtesting, and disciplined trading.
The more you practice reading price action without immediately entering a trade, the better you can understand how the different components work together.
Frequently Asked Questions (FAQs)
1. What is the PA Toolkit Lite Indicator?
PA Toolkit Lite is a price-action analysis indicator that combines tools such as market structure, liquidity sweeps, order blocks, and trend lines on a trading chart.
2. What does PA stand for in PA Toolkit Lite?
PA stands for Price Action. Price-action trading focuses on analyzing price movement, market structure, support and resistance, and other chart-based behavior.
3. Is PA Toolkit Lite a buy and sell indicator?
It can help traders identify potential trading areas, but it should not be treated as a guaranteed buy or sell signal. Traders should use confirmation and proper risk management.
4. What are liquidity sweeps?
Liquidity sweeps occur when price moves through an important high or low where liquidity may be concentrated and then reacts or reverses. They are commonly studied in price-action and SMC-style trading.
5. What are order blocks?
Order blocks are price areas that traders commonly study as potential zones of support or resistance following significant market moves. They should be treated as areas of interest rather than guaranteed reversal points.
6. Can beginners use PA Toolkit Lite?
Yes. Beginners can use it as a learning tool, but they should first understand basic concepts such as market structure, support, resistance, liquidity, and risk management.
7. Can PA Toolkit Lite be used for intraday trading?
Yes. The concepts can be applied to intraday charts. However, lower timeframes can contain more noise and false signals, so traders should use appropriate confirmation.
8. Can PA Toolkit Lite be used for swing trading?
Yes. Traders can use the toolkit to study higher-timeframe market structure, liquidity zones, order blocks, and trend lines for potential swing-trading setups.
9. Does PA Toolkit Lite guarantee profitable trades?
No. No technical indicator can guarantee profits. Market conditions can change, and every trading setup can fail.
10. Should I use PA Toolkit Lite with other indicators?
You can, but adding more indicators is not always better. Start with the toolkit’s core price-action features and add another indicator only if it provides useful, non-duplicated information.
11. What is the best setting for PA Toolkit Lite?
There is no universal best setting. The published version includes adjustable settings such as ZigZag length, liquidity length, order-block display, and trend-line sensitivity. Traders should test settings according to their market and timeframe.
12. Where can I learn more about the indicator?
The indicator’s published Pine Script and feature definitions can be examined to understand how its market-structure, liquidity, order-block, and trend-line components are implemented.
SEO-Friendly URL Slug:https://www.yourwebsite.com/pa-toolkit-lite-indicator