
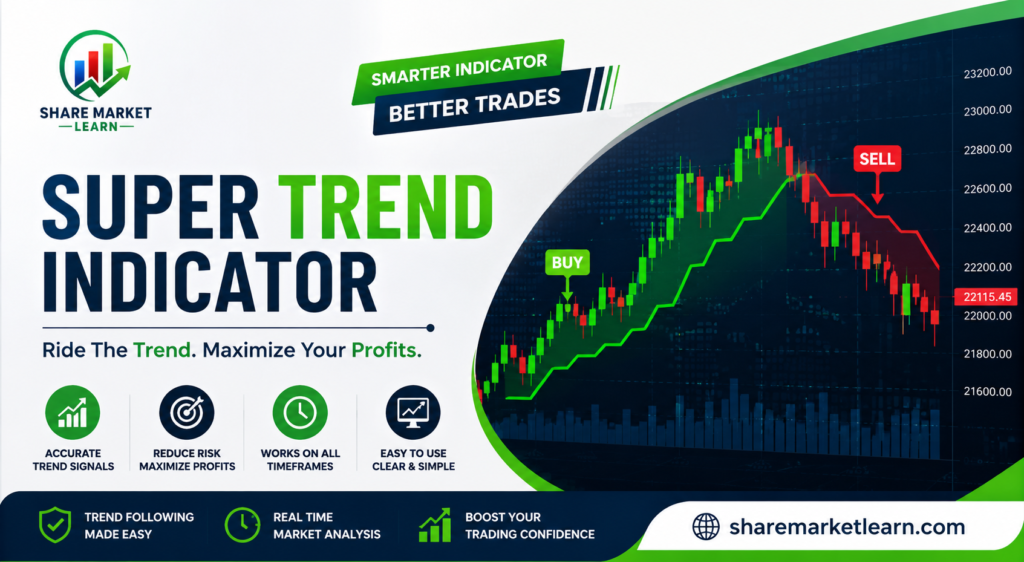
The Supertrend Indicator is a popular technical analysis tool used by traders to identify the current market trend and potential entry or exit points. It is especially useful for beginners because its signals are easy to understand: the indicator generally moves below the price during an uptrend and above the price during a downtrend.
Whether you trade stocks, indices, commodities, or other financial instruments, understanding the Supertrend Indicator can help you make more structured trading decisions. However, like any technical indicator, it should not be used alone.
In this guide, we will explain what the Supertrend Indicator is, how it works, how to use it, its settings, advantages, limitations, and some practical trading tips.
What Is the Supertrend Indicator?
The Supertrend Indicator is a trend-following technical indicator that helps traders determine whether the market is moving upward or downward.
It is based mainly on two important factors:
- Average True Range (ATR)
- A multiplier
The ATR measures market volatility, while the multiplier controls how sensitive the Supertrend is to price movements.
The indicator is usually displayed as a line on a price chart. The line changes position and color when the market trend changes.
For example:
- Green Supertrend line: Generally indicates an uptrend.
- Red Supertrend line: Generally indicates a downtrend.
The exact colors can vary depending on the trading platform.
How Does the Supertrend Indicator Work?
The Supertrend Indicator uses price and volatility to calculate a dynamic trend line.
One of the key components is the Average True Range (ATR). ATR measures how much an asset typically moves during a particular period.
When volatility increases, the Supertrend adjusts accordingly. This helps the indicator avoid reacting to every small price movement.
A simplified concept is:
Supertrend = Price-based bands adjusted according to ATR and a multiplier
The indicator creates upper and lower bands around the price. Depending on price movement, one of these bands becomes the active Supertrend line.
When the price moves above the relevant level, the indicator may switch to an uptrend. When the price moves below the relevant level, it may switch to a downtrend.
Supertrend Indicator Formula
Understanding the complete mathematical calculation is not necessary for beginners, but knowing the basic components can be helpful.
The calculation uses:
Basic Upper Band = (High + Low) / 2 + (Multiplier × ATR)
Basic Lower Band = (High + Low) / 2 − (Multiplier × ATR)
The final Supertrend calculation uses these bands and previous values to determine the active trend level.
The two most important settings are therefore:
- ATR Period
- ATR Multiplier
Best Supertrend Settings
There is no single Supertrend setting that works perfectly in every market.
A commonly used starting point is:
- ATR Period: 10
- Multiplier: 3
These settings are often referred to as Supertrend 10,3.
However, traders may adjust these settings depending on their strategy and timeframe.
Lower Multiplier
A lower multiplier makes the indicator more sensitive.
Advantages:
- Earlier signals
- More frequent trading opportunities
Disadvantages:
- More false signals
- More sensitivity to market noise
Higher Multiplier
A higher multiplier makes the indicator less sensitive.
Advantages:
- Fewer false signals
- Better ability to stay with larger trends
Disadvantages:
- Signals may arrive later
- Some early price movements may be missed
Therefore, traders should test different settings rather than assuming that one setting is always the best.
How to Use the Supertrend Indicator
The Supertrend Indicator can be used in several simple ways.
1. Identifying an Uptrend
When the Supertrend moves below the price, it generally indicates bullish momentum.
Traders may use this situation to look for buying opportunities.
However, instead of buying immediately, it can be useful to wait for confirmation from price action or another indicator.
2. Identifying a Downtrend
When the Supertrend moves above the price, it generally indicates bearish momentum.
This can alert traders to potential selling opportunities or help existing traders manage their positions.
Again, confirmation is useful because a single indicator can sometimes produce false signals.
3. Using Supertrend as a Trailing Stop-Loss
One of the most useful applications of the Supertrend Indicator is as a trailing stop-loss.
For example, if you are holding a stock during an uptrend, you can monitor the Supertrend line as the price moves higher.
If the price eventually breaks below the Supertrend level, it can be a signal to reduce or exit the position.
This approach can help traders remain in a trend while protecting themselves from a significant reversal.
Supertrend With Other Indicators
Although the Supertrend Indicator is useful, relying on it alone can result in false signals.
Many traders combine it with other technical indicators.
Supertrend + Moving Average
A moving average can help confirm the overall market direction.
For example, traders may consider buying only when:
- Price is above the moving average
- Supertrend indicates an uptrend
Similarly, they may consider bearish setups when price is below the moving average and Supertrend indicates a downtrend.
Supertrend + RSI
The Relative Strength Index (RSI) can provide additional momentum information.
For example:
- Supertrend indicates an uptrend
- RSI remains above a chosen momentum level
- Price action supports the bullish setup
This combination may provide stronger confirmation than using Supertrend alone.
Supertrend + Support and Resistance
Support and resistance levels can also improve Supertrend analysis.
A bullish Supertrend signal near a strong support area may be more interesting than a signal appearing in the middle of a sideways market.
Supertrend for Intraday Trading
The Supertrend Indicator is commonly used for intraday trading.
Traders can apply it to different timeframes such as:
- 5-minute charts
- 15-minute charts
- 30-minute charts
- 1-hour charts
However, shorter timeframes can produce more market noise and false signals.
For beginners, it may be better to first understand the indicator on higher timeframes before moving to very short-term charts.
Supertrend for Swing Trading
Supertrend can also be useful for swing trading.
Swing traders generally hold positions for several days or weeks, depending on the strategy.
Daily or 4-hour charts can provide a broader view of the market trend.
The indicator can help traders identify whether they should focus more on potential bullish or bearish setups.
Advantages of the Supertrend Indicator
The Supertrend Indicator has several benefits.
Easy to Understand
The visual trend line makes it relatively simple for beginners to interpret.
Helps Identify Trends
It can provide a quick view of the prevailing market direction.
Useful for Stop-Loss Management
The Supertrend line can act as a dynamic trailing stop-loss level.
Works Across Different Markets
It can be applied to stocks, indices, commodities, and other tradable assets.
Flexible Settings
Traders can change the ATR period and multiplier according to their strategy and timeframe.
Limitations of the Supertrend Indicator
Despite its advantages, Supertrend is not perfect.
False Signals
During sideways or choppy markets, the indicator can change direction frequently and generate losing signals.
Lagging Nature
Because Supertrend is based partly on previous price and volatility data, it may not identify a trend reversal at the exact beginning.
Not a Complete Trading System
Supertrend does not tell you everything about a trade. It does not independently evaluate company fundamentals, news, liquidity, risk-reward ratio, or broader market conditions.
For this reason, traders should combine it with proper risk management and additional analysis.
Tips for Using the Supertrend Indicator
Here are some simple tips for beginners:
- Do not depend on Supertrend alone.
- Use higher timeframes to understand the broader trend.
- Combine the indicator with support and resistance.
- Consider confirmation from price action or another indicator.
- Always use appropriate risk management.
- Avoid taking every signal in a sideways market.
- Backtest your strategy before using real money.
Remember that no technical indicator can guarantee profits.
Conclusion
The Supertrend Indicator is a simple and useful technical analysis tool for identifying market trends and managing trades. Its combination of price movement and ATR-based volatility makes it useful for both beginners and experienced traders.
A common starting point is the 10-period ATR with a 3x multiplier, but the best settings depend on the asset, timeframe, and trading strategy.
The most effective way to use Supertrend is not to treat every signal as a guaranteed buy or sell opportunity. Instead, combine it with price action, support and resistance, other indicators, and sensible risk management.
With practice and proper testing, the Supertrend Indicator can become a useful part of a structured trading strategy.
Frequently Asked Questions (FAQs)
1. What is the Supertrend Indicator?
The Supertrend Indicator is a trend-following technical analysis tool that helps traders identify bullish and bearish market trends. It is calculated using price data, ATR, and a multiplier.
2. What is the best Supertrend setting?
A commonly used setting is ATR Period 10 and Multiplier 3. However, there is no universally best setting. Traders should test different combinations based on their market and timeframe.
3. Is Supertrend good for beginners?
Yes. Supertrend is relatively easy to understand because it provides a visual indication of the market trend. Beginners should still learn risk management and avoid relying on one indicator.
4. Can Supertrend be used for intraday trading?
Yes. Supertrend can be used on intraday charts such as 5-minute, 15-minute, and 30-minute timeframes. Shorter timeframes can generate more false signals, so confirmation is important.
5. Can Supertrend be used as a stop-loss?
Yes. Many traders use the Supertrend level as a trailing stop-loss. As the trend moves in their favor, the Supertrend line can help them manage the position.
6. Is Supertrend a buy or sell indicator?
Supertrend can provide potential trend-change signals, but it should not be considered a guaranteed buy or sell indicator. Traders should use additional confirmation and risk management.
7. What is better: Supertrend or RSI?
Supertrend and RSI serve different purposes. Supertrend primarily focuses on trend direction, while RSI measures momentum. Using both together can provide additional information, depending on the trading strategy.
8. Does Supertrend work in sideways markets?
Supertrend can produce frequent false signals in sideways or highly choppy markets. It generally works better when the market has a clear directional trend.