
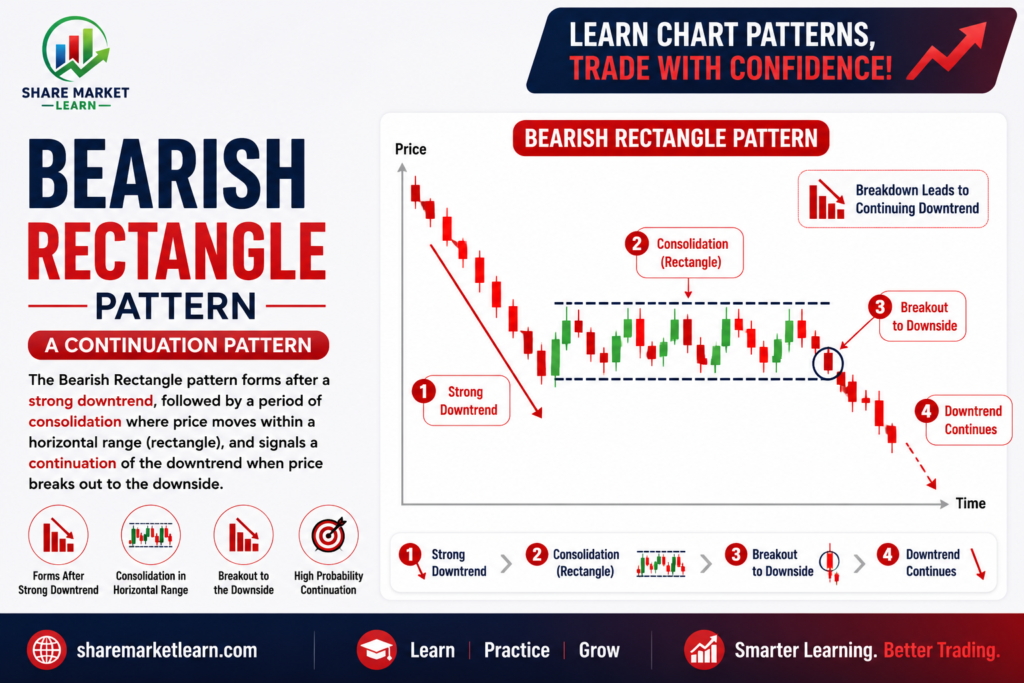
The Bearish Rectangle Pattern is one of the most reliable continuation chart patterns used in technical analysis. It appears during a downtrend and indicates that sellers are taking a short break before potentially pushing the price even lower.
Whether you trade stocks, forex, commodities, or cryptocurrencies, understanding the Bearish Rectangle pattern can help you identify high-probability selling opportunities and improve your trading decisions.
In this guide, you’ll learn what a Bearish Rectangle is, how it forms, why it works, how to trade it, common mistakes to avoid, and practical tips for better results.
What is a Bearish Rectangle Pattern?
A Bearish Rectangle Pattern is a price consolidation pattern that develops after a strong downward move. During this phase, the price moves sideways between a clear resistance level and a support level, creating a rectangle shape on the chart.
Eventually, if sellers regain control, the price breaks below the support line, signaling that the existing downtrend is likely to continue.
This pattern is called a continuation pattern because it usually continues the trend that existed before the consolidation.
Characteristics of a Bearish Rectangle
A Bearish Rectangle has several key characteristics:
- Appears during an existing downtrend.
- Price moves sideways for several candles.
- Multiple touches of resistance and support.
- Volume generally decreases during consolidation.
- Strong volume often appears during the downside breakout.
- Confirms only after the price closes below support.
These characteristics help traders distinguish a Bearish Rectangle from other chart patterns.
How Does the Bearish Rectangle Form?
The pattern forms in five simple stages:
1. Strong Downtrend
The market experiences heavy selling, pushing prices lower.
2. Consolidation Begins
After the sharp decline, buyers and sellers temporarily balance each other, causing the price to move sideways.
3. Support and Resistance Develop
The price repeatedly bounces between horizontal support and resistance, creating the rectangle shape.
4. Sellers Gain Strength
Selling pressure gradually increases while buying momentum weakens.
5. Breakdown
The price breaks below the support level with increased selling volume, confirming the Bearish Rectangle.
Psychology Behind the Bearish Rectangle
Understanding market psychology helps traders trust the pattern.
During the first decline, sellers dominate the market.
After this move, buyers attempt to stop the fall, while sellers temporarily take profits. This creates a period of sideways movement.
However, buyers fail to push prices above resistance.
Eventually, sellers return with stronger momentum, breaking support and continuing the downtrend.
This is why the Bearish Rectangle is considered a continuation pattern rather than a reversal pattern.
How to Identify a Bearish Rectangle
Follow these steps:
Step 1
Find an existing downtrend.
Step 2
Draw two horizontal lines:
- Upper resistance
- Lower support
Step 3
Ensure the price touches both levels multiple times.
Step 4
Watch for decreasing volume during consolidation.
Step 5
Wait for a breakout below support.
Never enter a trade before confirmation.
Trading Strategy for the Bearish Rectangle
Entry
Enter a sell trade only after the candle closes below the support level.
Aggressive traders may enter immediately after the breakout, while conservative traders often wait for a retest of the broken support, which may act as new resistance.
Stop Loss
Place the stop loss:
- Above the rectangle resistance, or
- Above the breakout candle.
Profit Target
A common method is to measure the height of the rectangle and project that distance downward from the breakout point.
This provides a logical target based on the pattern’s structure.
Example
Suppose a stock falls from ₹500 to ₹450.
It then trades between ₹445 and ₹450 for several days.
Eventually, the price breaks below ₹445 with strong volume.
A trader enters a sell trade near the breakout, places the stop loss above ₹450, and sets the target by measuring the rectangle’s height (₹5) and projecting it below the breakout level.
This approach offers a clear risk-to-reward setup.
Advantages of the Bearish Rectangle
- Easy to identify on charts.
- Works across multiple timeframes.
- Suitable for stocks, forex, crypto, and commodities.
- Provides clear entry and exit points.
- Offers favorable risk-to-reward opportunities.
- Helps traders stay aligned with the prevailing trend.
Disadvantages of the Bearish Rectangle
- False breakouts can occur.
- Low-volume breakouts may fail.
- Not every rectangle results in trend continuation.
- Requires patience for confirmation.
- Beginners may confuse it with other consolidation patterns.
Common Mistakes to Avoid
Many traders lose money because they:
- Enter before the breakout.
- Ignore trading volume.
- Place stop losses too close.
- Trade against the overall trend.
- Risk too much on a single trade.
- Mistake a range-bound market for a Bearish Rectangle.
Avoiding these mistakes can improve your consistency.
Tips for Better Trading
- Always confirm the overall market trend.
- Use volume as additional confirmation.
- Combine the pattern with moving averages or RSI.
- Wait for a candle close below support.
- Follow proper risk management.
- Never risk more than 1–2% of your trading capital on a single trade.
- Practice identifying the pattern on historical charts before trading live.
Conclusion
The Bearish Rectangle Pattern is a valuable continuation pattern that helps traders identify potential selling opportunities during an established downtrend. While no chart pattern guarantees success, combining the Bearish Rectangle with volume analysis, trend confirmation, and disciplined risk management can improve your trading decisions.
Patience is essential. Waiting for a confirmed breakout instead of anticipating one can help reduce false signals and increase the quality of your trades. Like any trading strategy, consistent practice and proper money management are key to long-term success.
Frequently Asked Questions (FAQs)
1. Is the Bearish Rectangle a continuation pattern?
Yes. It generally signals that an existing downtrend is likely to continue after a period of consolidation.
2. Can beginners use the Bearish Rectangle pattern?
Yes. It is one of the easier chart patterns to recognize, making it suitable for beginners who understand basic support and resistance.
3. Which markets does the Bearish Rectangle work in?
It can be used in stocks, forex, cryptocurrencies, commodities, and indices.
4. Is volume important in this pattern?
Yes. A breakout below support accompanied by higher trading volume is often considered a stronger confirmation than a breakout on low volume.
5. What indicators work well with the Bearish Rectangle?
Many traders combine it with Moving Averages, RSI, MACD, or Volume indicators for additional confirmation.
6. Can the pattern fail?
Yes. False breakouts happen in all financial markets. Using stop losses and proper risk management helps limit potential losses.