
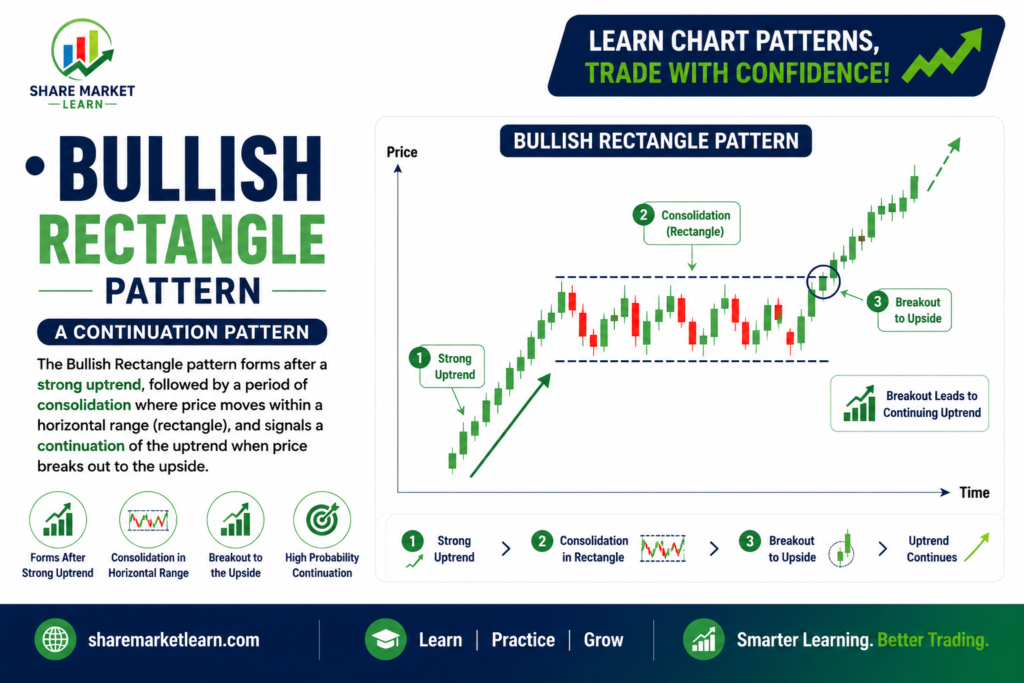
The Bullish Rectangle Pattern is one of the most reliable continuation patterns in technical analysis. It signals that an existing uptrend is likely to continue after a temporary period of sideways consolidation. This pattern is widely used by traders in the stock market, forex, cryptocurrency, commodities, and indices.
If you’re new to technical analysis, don’t worry. This guide explains the Bullish Rectangle Pattern in simple language, helping you understand how to identify it, trade it, and avoid common mistakes.
What is a Bullish Rectangle Pattern?
A Bullish Rectangle Pattern is a continuation chart pattern that forms after a strong upward price movement. Instead of continuing higher immediately, the price moves sideways between a horizontal resistance level and a horizontal support level.
This creates a rectangle-shaped trading range. Once buyers regain control, the price breaks above the resistance level, confirming the continuation of the uptrend.
The Bullish Rectangle represents a temporary pause where buyers and sellers are evenly matched before buyers eventually take control again.
Components of a Bullish Rectangle Pattern
A Bullish Rectangle consists of three key parts.
1. Strong Uptrend
Before the rectangle forms, the market should already be moving upward.
This shows strong buying momentum.
Without a prior uptrend, the pattern loses much of its reliability.
2. Rectangle Formation
The price moves sideways between two horizontal levels.
During this phase:
- Buyers take profits.
- New buyers wait for better prices.
- Sellers fail to push prices below support.
- Trading volume usually decreases.
The repeated highs create the resistance line, while repeated lows create the support line.
3. Breakout
The final stage is the breakout.
The price closes above the resistance level with increased trading volume.
This confirms that buyers have regained control and the bullish trend is likely to continue.
Why Does the Bullish Rectangle Pattern Form?
Markets rarely move in one direction without pauses.
A Bullish Rectangle develops because:
- Buyers push prices sharply higher.
- Some traders book profits.
- The market enters a consolidation phase.
- Selling pressure remains limited.
- Buyers return with renewed strength.
- The price breaks above resistance.
This process reflects healthy consolidation within a strong uptrend.
How to Identify a Bullish Rectangle Pattern
Look for these characteristics:
✔ Existing Uptrend
The market should already be making higher highs and higher lows.
✔ Horizontal Resistance
Price repeatedly fails to move above the same resistance level.
✔ Horizontal Support
Price repeatedly finds support at approximately the same level.
✔ Sideways Consolidation
The price moves within the rectangle for several candles.
✔ Volume Confirmation
Trading volume often decreases during consolidation and increases during the breakout.
Bullish Rectangle Trading Strategy
Many traders use the following strategy.
Step 1: Identify the Rectangle
Wait until the support and resistance levels become clear.
Avoid entering before the pattern is fully developed.
Step 2: Wait for Breakout Confirmation
A breakout is confirmed when the price closes above the resistance level.
This reduces the risk of false breakouts.
Step 3: Check Trading Volume
Strong trading volume supports the validity of the breakout.
Low volume may indicate a weak breakout.
Step 4: Enter the Trade
Enter a buy position after the breakout is confirmed.
Some traders wait for a retest of the broken resistance before buying.
Step 5: Place Stop Loss
A common stop-loss placement is:
- Below the rectangle’s support level.
- Slightly below the breakout candle.
This helps limit potential losses.
Step 6: Set the Profit Target
The target is generally calculated using:
Target = Height of the Rectangle
Measure the height of the rectangle and add it to the breakout point.
This provides an estimated profit target.
Example of a Bullish Rectangle Pattern
Imagine a stock rises from ₹200 to ₹250.
The price then trades between ₹245 and ₹250 for several days.
Eventually, buyers push the price above ₹250 with strong trading volume.
If the rectangle height is ₹5, the projected target becomes approximately ₹255.
This is a classic Bullish Rectangle Pattern.
Advantages of the Bullish Rectangle Pattern
Some important benefits include:
- Easy for beginners to identify.
- Works across stocks, forex, crypto, commodities, and indices.
- Clearly defines entry, stop-loss, and target levels.
- Suitable for trend-following strategies.
- Often provides attractive risk-to-reward opportunities.
Limitations of the Bullish Rectangle Pattern
Like every chart pattern, it has some limitations.
These include:
- False breakouts can occur.
- Low trading volume reduces reliability.
- Unexpected news can invalidate the setup.
- Poor money management increases trading risk.
Always use proper risk management and additional technical confirmation.
Common Mistakes Beginners Make
Avoid these common mistakes.
Buying Before the Breakout
Wait for confirmation instead of guessing.
Ignoring Volume
Volume is one of the strongest confirmation signals.
Trading Without Stop Loss
Protect your capital with a proper stop-loss order.
Ignoring the Overall Trend
Bullish Rectangles perform best during established uptrends.
Overtrading
Focus only on high-quality setups that meet your trading plan.
Tips for Better Results
Improve your trading by following these tips:
- Trade only in strong uptrends.
- Wait for confirmed breakouts.
- Use Moving Averages to confirm the trend.
- Combine the pattern with RSI or MACD.
- Look for increasing volume during the breakout.
- Maintain a minimum risk-to-reward ratio of 1:2.
- Practice using historical charts before trading with real money.
Best Timeframes
The Bullish Rectangle Pattern appears on almost every timeframe.
- 5-Minute Chart: Intraday traders
- 15-Minute Chart: Day traders
- 1-Hour Chart: Swing traders
- 4-Hour Chart: Position traders
- Daily Chart: Long-term investors
Higher timeframes generally produce more reliable trading signals.
Conclusion
The Bullish Rectangle Pattern is one of the most dependable continuation patterns in technical analysis. It reflects a temporary pause in an existing uptrend before buyers potentially resume control of the market. While no chart pattern guarantees success, combining the Bullish Rectangle with volume confirmation, trend analysis, and disciplined risk management can greatly improve your trading decisions.
If you’re a beginner, practice identifying this pattern on historical charts and demo accounts before trading with real money. Consistency, patience, and proper money management are essential for long-term trading success.
Frequently Asked Questions (FAQs)
1. What is a Bullish Rectangle Pattern?
A Bullish Rectangle Pattern is a continuation chart pattern that forms after a strong uptrend and indicates that the price may continue rising after a period of sideways consolidation.
2. Is the Bullish Rectangle Pattern reliable?
Yes. It is considered a reliable continuation pattern when confirmed by increased trading volume and an existing uptrend.
3. How do I confirm a Bullish Rectangle breakout?
A breakout is confirmed when the price closes above the resistance level with higher-than-average trading volume.
4. Where should I place my stop loss?
Most traders place the stop loss below the rectangle’s support level or below the breakout candle.
5. Can beginners trade the Bullish Rectangle Pattern?
Yes. It is beginner-friendly because it provides clear entry, stop-loss, and target levels. Beginners should first practice on demo accounts and follow proper risk management.
6. Does the Bullish Rectangle Pattern work in cryptocurrency trading?
Yes. The Bullish Rectangle Pattern works across stocks, forex, cryptocurrencies, commodities, and indices.
7. Which indicators work best with the Bullish Rectangle Pattern?
Popular indicators include Moving Averages, RSI, MACD, and Volume, which help confirm trend direction and breakout strength.