
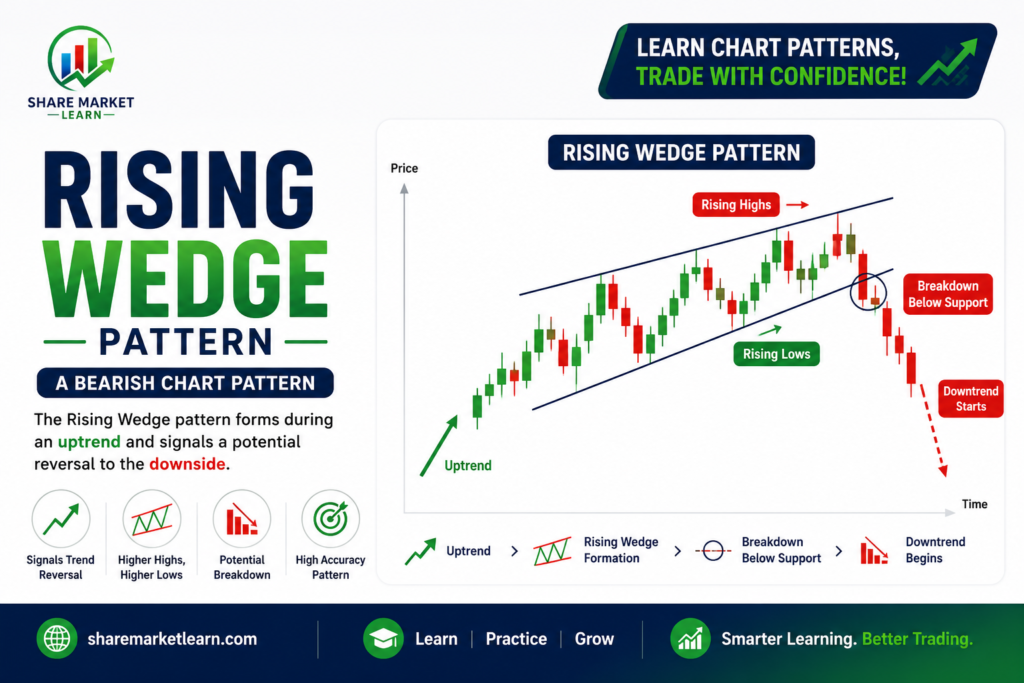
The Rising Wedge Pattern is one of the most widely recognized chart patterns in technical analysis. It is primarily considered a bearish reversal pattern, although it can also act as a continuation pattern in certain market conditions. Traders use this pattern to identify potential trend reversals and profitable trading opportunities.
The Rising Wedge Pattern is commonly seen in the stock market, forex, cryptocurrency, commodities, and indices. By understanding how it forms and how to trade it, beginners and experienced traders can improve their market analysis and decision-making.
In this article, you’ll learn what the Rising Wedge Pattern is, how it forms, the psychology behind it, trading strategies, advantages, disadvantages, and common mistakes to avoid.
What is a Rising Wedge Pattern?
A Rising Wedge Pattern is a chart pattern formed when the price moves upward between two converging trendlines. Both the upper resistance line and the lower support line slope upward, but the support line rises faster than the resistance line, causing the two lines to converge.
Although prices continue making higher highs and higher lows, the narrowing range indicates that bullish momentum is weakening. Once the price breaks below the lower trendline, the pattern is confirmed and often signals a bearish reversal.
Why is it Called a Rising Wedge?
The pattern gets its name because:
- The price moves upward.
- Two upward-sloping trendlines create a wedge-like shape.
- The distance between the trendlines gradually becomes smaller.
This narrowing structure reflects decreasing buying strength despite higher prices.
Psychology Behind the Rising Wedge Pattern
Understanding the market psychology behind the Rising Wedge helps traders understand why the pattern often leads to bearish moves.
Buyers Push Prices Higher
The market is in an uptrend, and buyers continue making higher highs.
Momentum Starts Weakening
Although prices continue rising, each new rally becomes smaller than the previous one.
Sellers Become More Active
Selling pressure gradually increases while buyers struggle to maintain momentum.
Breakdown Occurs
Eventually, sellers overwhelm buyers, and the price breaks below the lower trendline, confirming the bearish signal.
How to Identify a Rising Wedge Pattern
Look for the following characteristics:
- Appears during an uptrend or temporary upward correction.
- Two upward-sloping converging trendlines.
- Higher highs and higher lows.
- Declining trading volume during formation.
- Bearish breakout below the lower trendline.
A confirmed breakdown is essential before entering a trade.
How to Trade the Rising Wedge Pattern
Step 1: Identify the Pattern
Draw two upward-sloping trendlines connecting the highs and lows.
Step 2: Wait for Confirmation
Do not trade until the price closes below the lower trendline.
Step 3: Confirm with Volume
A breakout accompanied by higher selling volume increases reliability.
Step 4: Place Stop Loss
Place the stop loss slightly above the most recent swing high or above the upper trendline.
Step 5: Set a Profit Target
Measure the widest part of the wedge and project the same distance downward from the breakout point.
Example of the Rising Wedge Pattern
Imagine a stock rising from ₹500 to ₹700.
- The price forms higher highs and higher lows.
- The upward swings become smaller over time.
- Trading volume gradually decreases.
- The price finally breaks below the lower trendline near ₹680.
This breakdown confirms the Rising Wedge Pattern, suggesting a possible bearish trend.
Advantages of the Rising Wedge Pattern
1. Reliable Bearish Signal
It often indicates weakening buying momentum before a decline.
2. Easy to Recognize
The converging upward trendlines make the pattern visually distinctive.
3. Works Across Markets
The pattern can be used in:
- Stocks
- Forex
- Cryptocurrencies
- Commodities
- Indices
4. Clear Entry and Exit Levels
The breakout point, stop-loss level, and profit target are easy to define.
5. Suitable for Multiple Time Frames
The Rising Wedge Pattern works on intraday, daily, weekly, and monthly charts.
Disadvantages of the Rising Wedge Pattern
False Breakouts
Sometimes the price breaks below the trendline and quickly moves back inside the wedge.
Requires Patience
The pattern may take several days or weeks to develop.
Confirmation Is Necessary
Trading before the breakout increases the chance of losses.
Market Conditions Matter
The pattern may be less effective during highly volatile or news-driven markets.
Best Indicators to Use with the Rising Wedge Pattern
Using technical indicators alongside the pattern improves trade quality.
Relative Strength Index (RSI)
Bearish divergence or an RSI moving below 50 supports the reversal.
MACD
A bearish MACD crossover strengthens the sell signal.
Moving Averages
A breakdown below important moving averages confirms bearish momentum.
Volume Indicator
Increasing selling volume during the breakdown improves confidence in the trade.
Common Mistakes Traders Make
Avoid these common mistakes:
- Entering before the breakout.
- Ignoring trading volume.
- Setting stop losses too close.
- Trading without confirmation from indicators.
- Risking too much capital on one trade.
Risk Management Tips
Successful traders focus on protecting their capital.
- Risk only 1–2% of your account on a single trade.
- Always use a stop loss.
- Wait for a confirmed breakdown.
- Maintain a minimum risk-to-reward ratio of 1:2.
- Avoid emotional decision-making.
Is the Rising Wedge Pattern Reliable?
Yes, the Rising Wedge Pattern is considered a reliable bearish chart pattern when:
- It forms after an uptrend.
- The breakout occurs below the lower trendline.
- Selling volume increases during the breakout.
- Other indicators support the bearish view.
However, no pattern guarantees success, so proper confirmation and risk management remain essential.
Conclusion
The Rising Wedge Pattern is an important technical analysis tool that helps traders identify potential bearish reversals or continuation opportunities. Its narrowing price action reflects weakening buying pressure and increasing seller strength.
By waiting for a confirmed breakout, using supporting indicators such as RSI and MACD, and following disciplined risk management, traders can improve their chances of making informed trading decisions.
Practice identifying the Rising Wedge Pattern on historical charts before using it in live trading.
Frequently Asked Questions (FAQs)
1. Is the Rising Wedge Pattern bullish or bearish?
The Rising Wedge Pattern is generally considered a bearish pattern, especially when it forms after an uptrend.
2. Can the Rising Wedge Pattern appear in a downtrend?
Yes. In a downtrend, it can act as a bearish continuation pattern, signaling that the downward trend may continue after a temporary upward correction.
3. What confirms a Rising Wedge Pattern?
A close below the lower trendline with higher selling volume confirms the pattern.
4. Which time frame works best?
The Rising Wedge Pattern can be used on all time frames, but daily and weekly charts often provide more reliable signals.
5. Can the Rising Wedge Pattern fail?
Yes. False breakouts can occur. Using confirmation, stop-loss orders, and technical indicators can help reduce trading risk.