
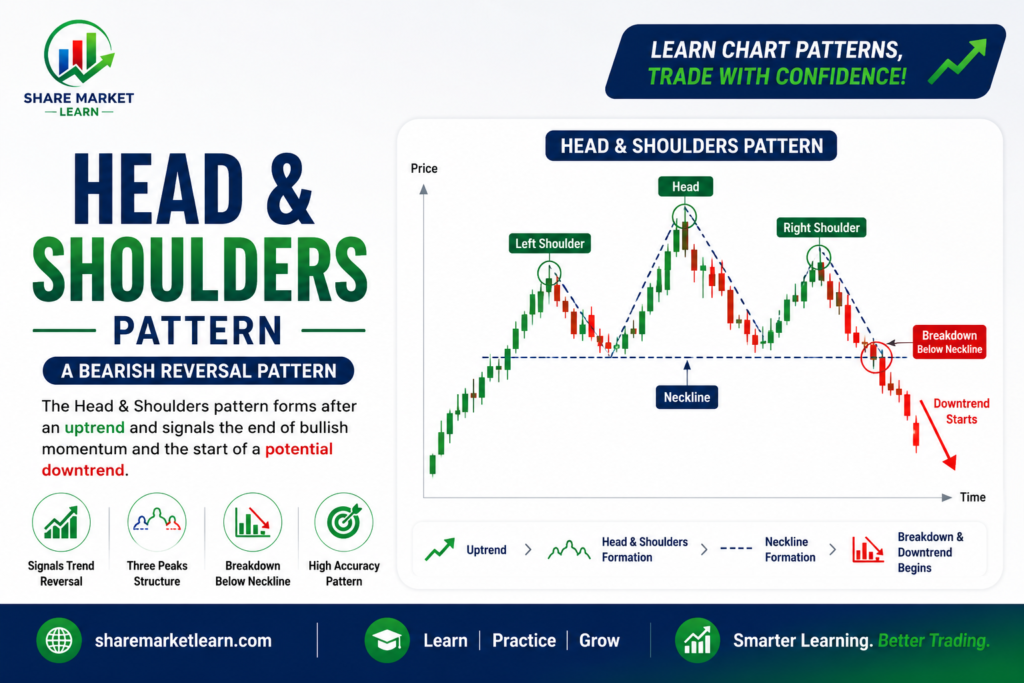
The Head and Shoulders Pattern is one of the most reliable and widely used bearish reversal chart patterns in technical analysis. It helps traders identify when an existing uptrend is likely coming to an end and when a new downtrend may begin.
This pattern is commonly used in the stock market, forex, cryptocurrencies, commodities, and indices because it provides clear entry, stop-loss, and target levels. When combined with volume analysis and technical indicators, it can become a powerful tool for identifying potential trend reversals.
In this article, you’ll learn what the Head and Shoulders Pattern is, how it forms, why it works, how to trade it, and the common mistakes traders should avoid.
What is a Head and Shoulders Pattern?
The Head and Shoulders Pattern is a bearish reversal pattern that appears after a strong uptrend. It consists of three peaks:
- Left Shoulder – The first peak followed by a pullback.
- Head – A higher peak than the left shoulder, followed by another pullback.
- Right Shoulder – A third peak that is usually similar in height to the left shoulder.
The lows between these peaks create a support line known as the neckline. The pattern is confirmed when the price breaks below the neckline, signaling a potential trend reversal from bullish to bearish.
Why is it Called a Head and Shoulders Pattern?
The pattern resembles the shape of a human head with two shoulders:
- The left shoulder represents the first buying attempt.
- The head represents the strongest buying move.
- The right shoulder shows that buyers can no longer create a new high.
This visual structure makes the pattern one of the easiest reversal patterns to recognize.
Psychology Behind the Head and Shoulders Pattern
Understanding the psychology behind the pattern helps traders make better decisions.
Left Shoulder
The market is in a strong uptrend, and buyers push prices to a new high. Profit booking causes a temporary decline.
Head
Buyers regain control and push prices to a higher high, creating the head. However, the following pullback shows that selling pressure is increasing.
Right Shoulder
Buyers attempt another rally but fail to make a higher high. This indicates weakening bullish momentum.
Neckline Breakdown
When the price breaks below the neckline, sellers gain control, confirming the bearish reversal.
How to Identify a Head and Shoulders Pattern
Look for these characteristics:
- Appears after a clear uptrend.
- Three peaks with the middle peak higher than the other two.
- Left and right shoulders are approximately equal in height.
- A clearly defined neckline connecting the two pullback lows.
- Breakdown below the neckline with increased trading volume.
The pattern is only confirmed after the neckline is broken.
How to Trade the Head and Shoulders Pattern
Step 1: Wait for the Pattern to Complete
Do not enter a trade while the right shoulder is still forming.
Step 2: Confirm the Neckline Break
Enter a short trade or exit long positions only after the price closes below the neckline.
Step 3: Check Trading Volume
Higher volume during the breakdown increases the reliability of the signal.
Step 4: Place Stop Loss
Place the stop loss slightly above the right shoulder to protect against false breakouts.
Step 5: Set a Profit Target
Measure the vertical distance from the head to the neckline. Project the same distance downward from the neckline to estimate the target price.
Example of the Head and Shoulders Pattern
Imagine a stock rising from ₹500 to ₹800.
- The first rally reaches ₹750 (left shoulder).
- The second rally reaches ₹800 (head).
- The third rally reaches ₹750 again (right shoulder).
- The price then falls below the neckline at ₹700 with strong selling volume.
This breakdown confirms the Head and Shoulders Pattern and suggests that a bearish trend may begin.
Advantages of the Head and Shoulders Pattern
1. Highly Reliable
It is considered one of the most dependable bearish reversal patterns.
2. Easy to Recognize
The distinctive shape makes it simple for traders to identify.
3. Clear Trading Levels
The pattern provides well-defined entry, stop-loss, and target levels.
4. Works Across Different Markets
It can be used in:
- Stocks
- Forex
- Cryptocurrencies
- Commodities
- Indices
5. Suitable for Multiple Time Frames
The pattern works on intraday, daily, weekly, and monthly charts, although higher time frames generally provide stronger signals.
Disadvantages of the Head and Shoulders Pattern
False Breakdowns
Sometimes the price briefly breaks below the neckline before reversing upward.
Time-Consuming Formation
The pattern may take days or even weeks to develop.
Requires Confirmation
Entering before the neckline breaks increases the risk of false signals.
Imperfect Shapes
Real market patterns are rarely perfectly symmetrical.
Best Indicators to Use with the Head and Shoulders Pattern
Using technical indicators alongside the pattern can improve accuracy.
Relative Strength Index (RSI)
Bearish divergence or an RSI falling below 50 supports the reversal.
MACD
A bearish MACD crossover provides additional confirmation.
Moving Averages
A break below important moving averages strengthens the bearish outlook.
Volume Indicator
Increasing selling volume during the neckline break improves the reliability of the signal.
Common Mistakes Traders Make
Avoid these common mistakes:
- Entering before the neckline is broken.
- Ignoring trading volume.
- Placing stop losses too close.
- Trading against the overall market trend.
- Risking too much money on a single trade.
Risk Management Tips
Successful trading requires disciplined risk management.
- Risk only 1–2% of your total trading capital on a single trade.
- Always use a stop loss.
- Wait for confirmation before entering.
- Avoid emotional decisions.
- Aim for a minimum risk-to-reward ratio of 1:2.
Is the Head and Shoulders Pattern Reliable?
Yes, the Head and Shoulders Pattern is widely regarded as one of the most reliable bearish reversal patterns, especially when:
- It forms after a strong uptrend.
- The neckline breaks with high trading volume.
- Technical indicators support the reversal.
- Proper risk management is followed.
Although no pattern guarantees success, combining multiple forms of analysis improves the probability of profitable trades.
Conclusion
The Head and Shoulders Pattern is a powerful bearish reversal pattern that signals the possible end of an uptrend. By understanding its structure, market psychology, and confirmation rules, traders can use it to identify potential selling opportunities with greater confidence.
Always combine the pattern with volume analysis, technical indicators, and sound risk management. Practicing on historical charts before trading with real money can help you build confidence and improve consistency.
Frequently Asked Questions (FAQs)
1. Is the Head and Shoulders Pattern bullish or bearish?
It is a bearish reversal pattern that suggests a potential change from an uptrend to a downtrend.
2. What confirms a Head and Shoulders Pattern?
A close below the neckline with strong selling volume confirms the pattern.
3. What is the opposite of the Head and Shoulders Pattern?
The Inverse Head and Shoulders Pattern, which is a bullish reversal pattern that appears after a downtrend.
4. Which time frame is best for the Head and Shoulders Pattern?
The pattern can appear on any time frame, but daily and weekly charts usually provide more reliable signals.
5. Can the Head and Shoulders Pattern fail?
Yes. False breakouts and changing market conditions can cause the pattern to fail. Proper risk management and confirmation can help reduce losses.