
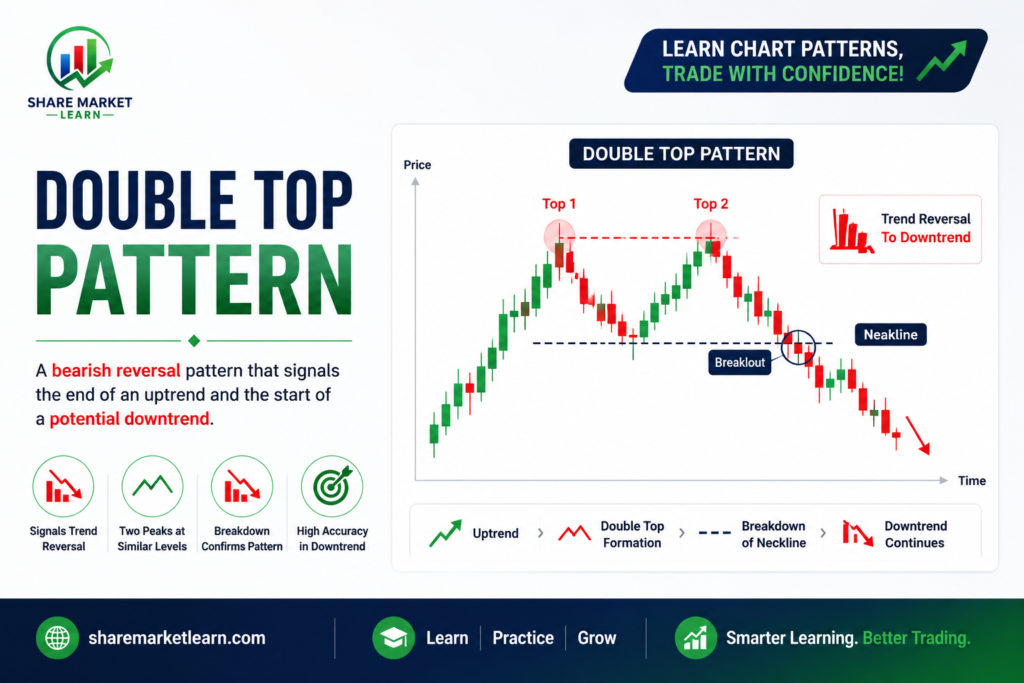
The Double Top Pattern is one of the most popular and reliable bearish reversal chart patterns used in technical analysis. It helps traders identify when an uptrend is losing momentum and when a potential downward trend may begin.
Whether you trade stocks, forex, cryptocurrencies, or commodities, understanding the Double Top Pattern can improve your decision-making and help you avoid buying near market tops.
In this guide, you’ll learn what the Double Top Pattern is, how it forms, why it works, how to trade it, and the common mistakes traders should avoid.
What is a Double Top Pattern?
A Double Top Pattern is a bearish reversal chart pattern that appears after a strong uptrend. It is formed when the price reaches a resistance level twice but fails to break above it. This creates two peaks (tops) at nearly the same price level, separated by a temporary decline.
The pattern is confirmed when the price breaks below the support level between the two peaks, known as the neckline. This breakout signals that sellers have gained control and that the trend may reverse from bullish to bearish.
Why is it Called a Double Top?
The pattern gets its name because it forms two distinct peaks at approximately the same price level.
The structure includes:
- First Peak
- Pullback to Support (Neckline)
- Second Peak
- Breakdown below the Neckline
The chart resembles the letter “M”, making it easy for traders to recognize.
Psychology Behind the Double Top Pattern
Understanding the psychology behind the pattern helps traders interpret market behavior more effectively.
First Peak
Buyers push the price to a new high, but profit booking causes a temporary decline.
Pullback
The price falls to a support level where buyers attempt to regain control.
Second Peak
Buyers push the price back toward the previous high, but they fail to break above the resistance. This indicates weakening buying pressure.
Breakdown
Once the price falls below the neckline, sellers take control, confirming a bearish reversal.
How to Identify a Double Top Pattern
Look for these characteristics:
- Appears after a strong uptrend.
- Two peaks at nearly the same price level.
- A noticeable decline between the peaks.
- A clear support level (neckline).
- Breakdown below the neckline with increased trading volume.
The pattern is only considered valid after the neckline is broken.
How to Trade the Double Top Pattern
Step 1: Wait for the Pattern to Form
Allow both peaks to develop completely before considering a trade.
Step 2: Confirm the Breakdown
Enter a short trade or exit long positions only after the price closes below the neckline.
Step 3: Check Volume
Higher trading volume during the breakdown increases the reliability of the signal.
Step 4: Place Stop Loss
A common stop-loss placement is just above the second peak to protect against false breakouts.
Step 5: Set a Profit Target
Measure the distance between the peaks and the neckline. Project the same distance downward from the neckline to estimate a target price.
Example of the Double Top Pattern
Imagine a stock rising from ₹400 to ₹600.
- The price reaches ₹600 and falls to ₹560.
- Buyers push it back to ₹600, but it fails to move higher.
- The price then breaks below ₹560 with strong selling volume.
This breakdown confirms the Double Top Pattern, and traders may expect further downside.
Advantages of the Double Top Pattern
1. Strong Bearish Reversal Signal
It often marks the end of an uptrend.
2. Easy to Identify
The two peaks make the pattern simple for beginners to recognize.
3. Works in Multiple Markets
The pattern is effective in:
- Stocks
- Forex
- Cryptocurrencies
- Commodities
- Indices
4. Clear Entry and Exit Levels
The neckline provides a logical entry point, while the second peak offers a practical stop-loss level.
5. Better Accuracy with Volume
A high-volume breakdown improves the reliability of the pattern.
Disadvantages of the Double Top Pattern
False Breakdowns
Sometimes the price briefly falls below the neckline and quickly reverses upward.
Requires Confirmation
Trading before the neckline breaks can lead to unnecessary losses.
Not Always Perfect
The two peaks may not be exactly the same height.
Less Reliable in Sideways Markets
The pattern performs best after a clear uptrend and may be less effective in ranging markets.
Best Indicators to Use with the Double Top Pattern
Combining technical indicators with the Double Top Pattern can improve trading accuracy.
Relative Strength Index (RSI)
An RSI showing bearish divergence or moving below 50 supports the reversal.
MACD
A bearish MACD crossover adds confirmation to the sell signal.
Moving Averages
A price drop below key moving averages strengthens the bearish outlook.
Volume Indicator
Increasing selling volume during the neckline break confirms stronger market participation.
Common Mistakes Traders Make
Avoid these common mistakes:
- Entering before the neckline breaks.
- Ignoring trading volume.
- Setting stop losses too close.
- Trading against the broader market trend.
- Risking too much capital on a single trade.
Risk Management Tips
Good risk management is essential for long-term trading success.
- Risk only 1–2% of your trading capital per trade.
- Always use a stop loss.
- Wait for confirmation before entering.
- Avoid emotional decisions.
- Maintain a favorable risk-to-reward ratio, such as 1:2 or higher.
Is the Double Top Pattern Reliable?
The Double Top Pattern is considered one of the most reliable bearish reversal patterns when used correctly. Its effectiveness improves when combined with:
- Strong selling volume
- Trend confirmation
- Technical indicators such as RSI and MACD
- Proper risk management
No chart pattern guarantees success, but disciplined trading and confirmation can significantly improve your probability of success.
Conclusion
The Double Top Pattern is a valuable chart pattern for identifying potential bearish reversals after a strong uptrend. By waiting for the neckline breakdown, confirming the move with volume, and following proper risk management, traders can make more informed trading decisions.
Like all technical analysis tools, the Double Top Pattern works best when used alongside other indicators and within a well-planned trading strategy. Practice identifying the pattern on historical charts before applying it in live markets.
Frequently Asked Questions (FAQs)
1. Is the Double Top Pattern bullish or bearish?
The Double Top Pattern is a bearish reversal pattern that signals a possible trend change from upward to downward.
2. What confirms a Double Top Pattern?
A close below the neckline, ideally supported by higher trading volume, confirms the pattern.
3. Can beginners trade the Double Top Pattern?
Yes. It is one of the easiest reversal patterns for beginners to recognize, but they should always wait for confirmation before entering a trade.
4. Which time frame is best for the Double Top Pattern?
The pattern can appear on any time frame, but daily and weekly charts generally provide more reliable signals than very short time frames.
5. Can the Double Top Pattern fail?
Yes. False breakdowns can occur. Using stop-loss orders and combining the pattern with other technical indicators helps reduce risk.