
Introduction
Candlestick patterns play a vital role in technical analysis by helping traders understand market sentiment and identify potential trading opportunities. One of the most useful price action patterns is the Bearish Inside Bar. Although it looks simple, this pattern can provide valuable clues about a possible bearish reversal or continuation when used correctly.
Whether you’re new to trading or already have some experience, learning how to recognize and trade the Bearish Inside Bar can improve your market analysis. However, like any trading setup, it works best when combined with other technical tools such as support and resistance, trendlines, volume, and moving averages.
In this guide, you’ll learn what a Bearish Inside Bar is, how it forms, the psychology behind the pattern, how to trade it, common mistakes to avoid, and answers to frequently asked questions.
What Is a Bearish Inside Bar?
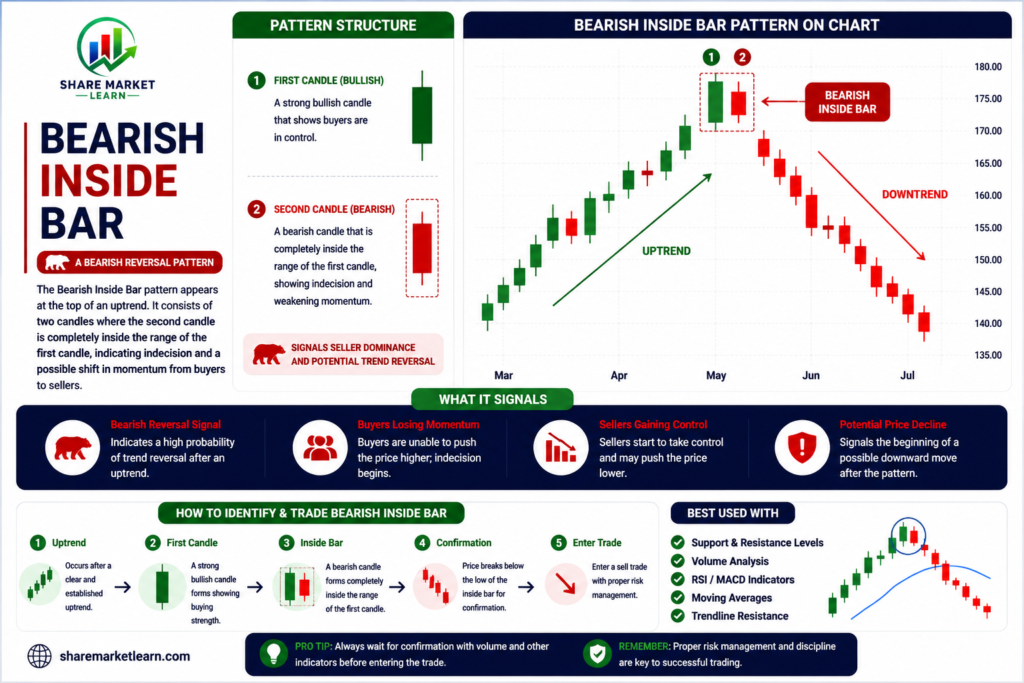
A Bearish Inside Bar is a two-candle price action pattern where the second candle forms completely within the high and low range of the previous candle (known as the Mother Bar). The pattern generally appears after an uptrend or during a pullback in a downtrend and signals that selling pressure may soon increase.
The pattern consists of:
- Mother Bar: A large candle that establishes the trading range.
- Inside Bar: A smaller candle whose high is lower than the Mother Bar’s high and whose low is higher than the Mother Bar’s low.
When the price later breaks below the low of the Mother Bar or Inside Bar, many traders consider it a bearish confirmation.
Why Is It Called an Inside Bar?
The name Inside Bar comes from the fact that the entire second candle is “inside” the range of the first candle.
This represents a period of market consolidation where neither buyers nor sellers are in full control. If the breakout occurs to the downside after an uptrend, it often indicates that sellers are gaining strength and buyers are losing momentum.
How Does a Bearish Inside Bar Form?
The pattern usually develops in the following stages:
1. Strong Uptrend
The market is moving upward, showing strong buying interest.
2. Formation of the Mother Bar
A relatively large bullish or bearish candle forms, creating a wide trading range.
3. Formation of the Inside Bar
The next candle remains completely within the range of the Mother Bar, showing reduced volatility and market indecision.
4. Bearish Breakout
The price breaks below the low of the Mother Bar or Inside Bar, confirming that sellers have taken control.
Market Psychology Behind the Bearish Inside Bar
Understanding the psychology behind this pattern helps traders use it more effectively.
Buyers Lose Momentum
After a strong upward move, buyers begin to lose confidence.
Market Pauses
The Inside Bar reflects hesitation. Neither buyers nor sellers are willing to make a decisive move.
Sellers Become Active
Once the price breaks below the pattern, sellers enter aggressively, increasing downward momentum.
Trend Reversal or Continuation
The breakout suggests that bearish sentiment is becoming stronger, potentially leading to further price declines.
How to Identify a Valid Bearish Inside Bar
Look for these characteristics:
- The second candle is completely inside the Mother Bar’s range.
- The pattern forms after an uptrend or during a bearish pullback.
- The Inside Bar has a smaller body than the Mother Bar.
- Selling volume increases during the breakout.
- The downside breakout is confirmed by the next candle.
The more confirmations you have, the more reliable the setup becomes.
How to Trade the Bearish Inside Bar
Successful traders usually wait for confirmation before entering a trade.
Step 1: Identify the Pattern
Ensure the second candle remains entirely inside the Mother Bar.
Step 2: Wait for the Breakout
Avoid entering before the breakout. Wait until the price moves below the low of the Inside Bar or Mother Bar.
Step 3: Enter the Trade
Many traders consider entering a sell position after the bearish breakout is confirmed.
Step 4: Place a Stop-Loss
A common stop-loss placement is just above the high of the Mother Bar.
Step 5: Set a Profit Target
Potential profit targets include:
- Previous support levels
- A fixed risk-to-reward ratio (such as 1:2 or 1:3)
- Trendline support
- Moving average levels
Best Indicators to Use with a Bearish Inside Bar
The pattern becomes more effective when combined with additional technical indicators.
Support and Resistance
A Bearish Inside Bar near a major resistance level increases the probability of a successful reversal.
Volume
Higher selling volume during the breakout confirms stronger bearish momentum.
Moving Averages
If the breakout occurs below a key moving average, the signal becomes more reliable.
Relative Strength Index (RSI)
An overbought RSI reading supports the possibility of a bearish reversal.
MACD
A bearish MACD crossover provides extra confirmation before entering a trade.
Advantages of the Bearish Inside Bar
This pattern offers several benefits:
- Easy to identify on price charts.
- Suitable for beginners and experienced traders.
- Works across stocks, forex, commodities, indices, and cryptocurrencies.
- Can be used on multiple timeframes.
- Helps traders identify breakout opportunities.
Limitations of the Bearish Inside Bar
Like every technical pattern, it has limitations.
- False breakouts can occur.
- It requires confirmation before trading.
- It is less reliable in sideways markets.
- It should never be used without proper risk management.
- Market news can invalidate technical signals.
Common Mistakes Beginners Make
Avoid these common errors when trading the Bearish Inside Bar.
Trading Before Confirmation
Entering before the breakout increases the risk of false signals.
Ignoring the Overall Trend
The pattern performs best after a clear uptrend or during bearish continuation setups.
Not Using Stop-Loss Orders
Protecting your capital is more important than maximizing profits.
Relying Only on One Pattern
Combine the Bearish Inside Bar with support and resistance, trendlines, volume, and indicators for stronger trade setups.
Example of a Bearish Inside Bar
Imagine a stock has been rising steadily for several days.
A large bullish candle forms, creating the Mother Bar. The following day, the stock trades within the previous day’s range and forms a much smaller Inside Bar.
On the third day, the price falls below the low of the Inside Bar with increased selling volume.
This downside breakout confirms the Bearish Inside Bar pattern and may signal the beginning of a bearish move.
Tips for Beginners
- Practice identifying the pattern using historical charts.
- Wait for a confirmed breakout before entering.
- Combine the pattern with support and resistance levels.
- Always use stop-loss orders.
- Focus on risk management rather than predicting every market move.
- Keep a trading journal to improve your strategy over time.
Consistency and discipline are essential for long-term trading success.
Conclusion
The Bearish Inside Bar is a simple yet powerful candlestick pattern that can help traders identify potential bearish reversals and continuation opportunities. It reflects a temporary pause in the market before sellers regain control and push prices lower.
While the pattern can provide valuable trading signals, it should never be used on its own. Combining it with technical indicators, support and resistance analysis, confirmation candles, and proper risk management can significantly improve trading decisions.
By practicing regularly and following a disciplined trading plan, beginners can confidently incorporate the Bearish Inside Bar into their price action trading strategy.
Frequently Asked Questions (FAQs)
1. What is a Bearish Inside Bar?
A Bearish Inside Bar is a two-candle pattern where the second candle forms completely within the range of the first candle and is followed by a bearish breakout.
2. Is the Bearish Inside Bar a reversal pattern?
It can act as both a bearish reversal pattern after an uptrend and a continuation pattern during a downtrend.
3. Is the Bearish Inside Bar reliable?
It becomes more reliable when confirmed by a downside breakout, strong volume, and other technical indicators.
4. Which timeframe works best?
The pattern works on all timeframes, but signals on daily and weekly charts are generally considered more reliable than those on very short-term charts.
5. Should beginners trade every Bearish Inside Bar?
No. Traders should wait for confirmation and evaluate the overall market context before taking a trade.
6. Can the Bearish Inside Bar be used in all financial markets?
Yes. It can be applied to stocks, forex, commodities, indices, and cryptocurrencies because it is based on universal price action principles.