
The stock market often communicates through price movements, and candlestick patterns help traders understand those messages. Among the many candlestick patterns used in technical analysis, the Bearish Engulfing Candle is one of the most popular reversal signals.
Whether you are a beginner in the share market or someone looking to improve your chart-reading skills, understanding this pattern can help you make better trading decisions.
In this article, we’ll explore what a Bearish Engulfing Candle is, how it forms, why it is important, and how traders use it in real market situations.
What Is a Bearish Engulfing Candle?
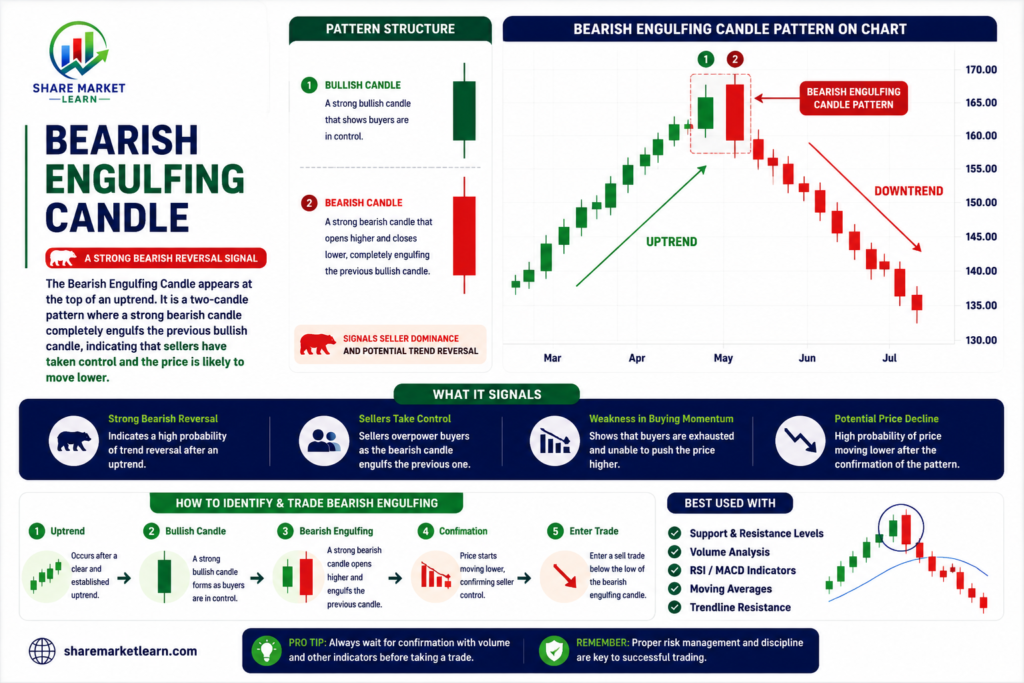
A Bearish Engulfing Candle is a two-candlestick reversal pattern that appears after an uptrend. It suggests that buyers may be losing control and sellers could be preparing to push prices lower.
The pattern consists of two candles:
- The first candle is bullish (usually green), showing that buyers are still active.
- The second candle is bearish (usually red) and completely engulfs the body of the first candle.
This change in momentum often signals that a trend reversal from bullish to bearish may occur.
Why Is It Called “Engulfing”?
The word “engulfing” means covering completely.
In this pattern, the body of the second bearish candle completely covers or engulfs the body of the previous bullish candle. This shows that sellers have overwhelmed buyers during that trading period.
The stronger the engulfing effect, the more attention traders pay to the pattern.
How Does a Bearish Engulfing Pattern Form?
The formation generally follows these steps:
Step 1: Existing Uptrend
The market should already be moving upward. Buyers are confident, and prices are rising.
Step 2: First Bullish Candle
A small or moderate bullish candle forms, indicating continued buying interest.
Step 3: Second Bearish Candle
The next candle opens above or near the previous close but then declines sharply, closing below the opening price of the first candle.
As a result, the bearish candle completely engulfs the previous candle’s body.
This sudden shift suggests that sellers have entered the market aggressively.
What Does the Bearish Engulfing Candle Indicate?
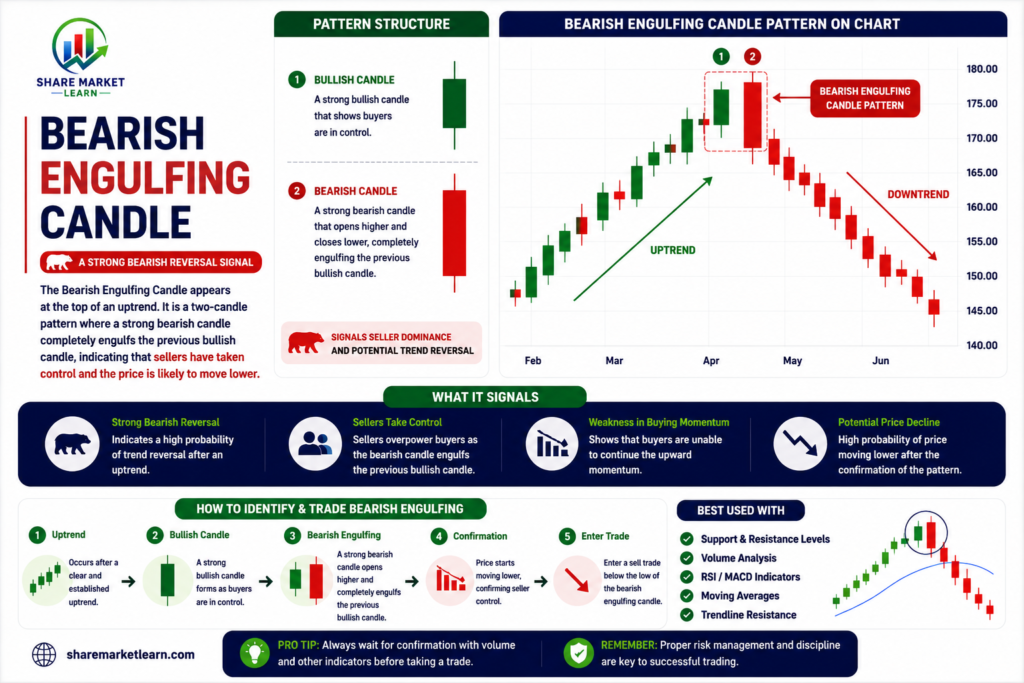
The Bearish Engulfing pattern reflects a change in market sentiment.
It may indicate:
- Buyers are losing strength.
- Sellers are gaining control.
- The current uptrend may be weakening.
- A short-term or long-term reversal could occur.
However, it is important to remember that no candlestick pattern guarantees future price movement. It simply increases the probability of a particular outcome.
Why Do Traders Use This Pattern?
Many traders watch for Bearish Engulfing patterns because they provide early warning signs of potential reversals.
Some advantages include:
Easy to Identify
Even beginners can learn to spot this pattern quickly on price charts.
Useful Across Markets
It can be used in:
- Stocks
- Commodities
- Forex
- Cryptocurrencies
- Indices
Works on Multiple Time Frames
The pattern can appear on:
- 5-minute charts
- 15-minute charts
- Hourly charts
- Daily charts
- Weekly charts
How to Trade a Bearish Engulfing Candle
Successful traders rarely rely on a single pattern. Instead, they combine it with other technical tools.
Here is a simple approach.
Wait for Confirmation
Do not enter a trade immediately after spotting the pattern.
Confirmation may come when the next candle closes below the bearish engulfing candle’s low.
This provides additional evidence that sellers remain in control.
Identify Resistance Levels
Bearish Engulfing patterns occurring near resistance zones often carry more significance.
Resistance is an area where prices have previously struggled to move higher.
Use Volume Analysis
Higher trading volume during the bearish engulfing candle suggests stronger participation by sellers.
This can increase the reliability of the signal.
Place a Stop Loss
Risk management is essential.
Many traders place a stop loss above the high of the engulfing candle to limit potential losses if the trade moves against them.
Set a Profit Target
Profit targets can be based on:
- Previous support levels
- Risk-to-reward ratios
- Technical indicators
Having a predefined exit plan helps maintain discipline.
Example of a Bearish Engulfing Trade
Imagine a stock has been rising steadily for several days.
On Day One, it closes higher and forms a bullish candle.
The next day, the stock opens slightly higher. However, selling pressure increases throughout the session, causing the price to fall sharply.
The second candle closes below the opening price of the previous bullish candle, creating a Bearish Engulfing pattern.
A trader may wait for confirmation and enter a short position if the following candle continues moving downward.
This practical approach reduces emotional decision-making.
Common Mistakes Traders Make
Although the Bearish Engulfing pattern is useful, beginners often make avoidable mistakes.
Trading Without Confirmation
Entering too early can result in false signals.
Ignoring the Trend
The pattern is most effective after a noticeable uptrend.
Using it during sideways markets can produce unreliable results.
Forgetting Risk Management
Even high-probability setups can fail.
Always protect your capital with stop losses and proper position sizing.
Depending Only on One Indicator
Combining candlestick patterns with support and resistance, moving averages, or volume analysis often improves decision-making.
How Reliable Is the Bearish Engulfing Pattern?
The Bearish Engulfing pattern is considered one of the stronger reversal signals in technical analysis.
However, its reliability depends on several factors:
- The strength of the previous uptrend
- Market conditions
- Trading volume
- Confirmation from other indicators
- The time frame being analyzed
Professional traders understand that probabilities matter more than certainty.
No setup wins every time.
Tips for Beginners
If you are new to candlestick trading, keep these tips in mind:
- Practice identifying patterns on historical charts.
- Use a demo account before risking real money.
- Focus on quality setups instead of frequent trades.
- Follow strict risk management rules.
- Keep learning and improving your trading skills.
Patience and discipline often contribute more to long-term success than finding the “perfect” strategy.
Conclusion
The Bearish Engulfing Candle is a powerful candlestick pattern that helps traders identify potential bearish reversals after an uptrend. It signals a shift in momentum where sellers begin to overpower buyers.
While the pattern can offer valuable insights, it should never be used in isolation. Combining it with confirmation signals, support and resistance levels, volume analysis, and proper risk management can improve its effectiveness.
For beginners, mastering the Bearish Engulfing pattern is an excellent step toward understanding price action and technical analysis. With consistent practice and disciplined execution, this simple yet effective pattern can become a valuable part of your trading toolkit.
Remember, successful trading is not about predicting the market perfectly—it’s about managing risk, following a strategy, and making informed decisions over time.