
Introduction
Candlestick patterns are among the most powerful tools used in technical analysis. They help traders understand market sentiment and identify potential trading opportunities. One of the strongest bullish reversal patterns is the Bullish Kicker Candle Pattern.
Unlike many other reversal patterns that indicate a gradual shift in market sentiment, the Bullish Kicker signals a sudden and dramatic change from bearishness to bullishness. This pattern often appears after major news events, earnings announcements, or unexpected market developments that quickly change investor sentiment.
In this article, you’ll learn what the Bullish Kicker Candle Pattern is, how it forms, the psychology behind it, how to trade it effectively, and its advantages and limitations.
What Is a Bullish Kicker Candle Pattern?
The Bullish Kicker Candle Pattern is a two-candlestick bullish reversal pattern that appears after a downtrend. It signals a sharp shift in market sentiment, indicating that buyers have suddenly taken control from sellers.
The pattern consists of:
- A bearish candle during an existing downtrend.
- A bullish candle that opens significantly above the previous candle’s opening price, creating a gap and moving strongly upward.
The gap between the two candles reflects a powerful change in sentiment and often suggests the beginning of a new uptrend.
Because of its strength, many traders consider the Bullish Kicker one of the most reliable reversal patterns in candlestick analysis.
Structure of the Bullish Kicker Pattern
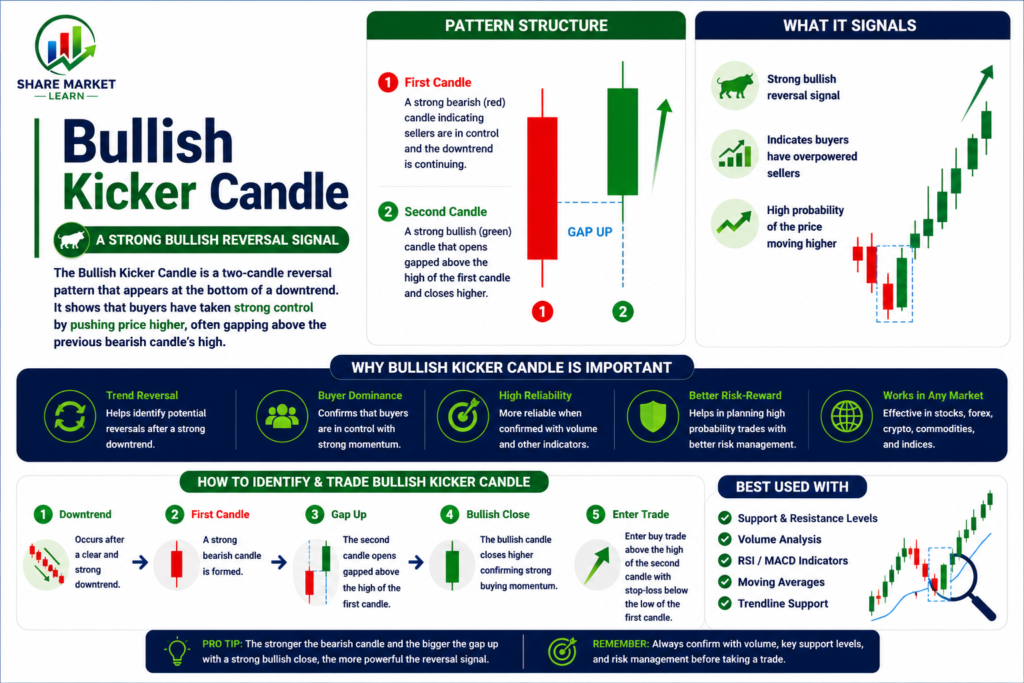
To identify the Bullish Kicker Pattern, traders should look for the following characteristics.
First Candle
- A bearish candle.
- Appears during an established downtrend.
- Reflects continued selling pressure.
Second Candle
- Opens above the opening price of the previous bearish candle.
- Creates a noticeable gap between the two candles.
- Forms a strong bullish body.
- Closes near its high.
The sharp gap higher is the defining characteristic of this pattern.
Psychology Behind the Bullish Kicker Pattern
Understanding the psychology behind the pattern helps explain why it is considered so powerful.
During the first candle, sellers remain in control, pushing prices lower and maintaining the bearish trend.
However, before the next session begins, something changes market sentiment dramatically. Positive news, strong earnings results, economic developments, or increased buying interest can shift traders’ outlook.
As a result, the market opens significantly higher, catching bearish traders off guard. Buyers aggressively push prices upward throughout the session.
This sudden reversal in sentiment often forces short sellers to exit their positions while attracting new buyers, creating strong bullish momentum.
The Bullish Kicker reflects one of the fastest transitions from fear to optimism in the market.
How to Identify a Bullish Kicker Pattern
Follow these steps to identify the pattern correctly.
Step 1: Look for an Existing Downtrend
The pattern should occur after a clear bearish movement.
Step 2: Identify a Bearish Candle
The first candle should confirm that sellers were previously in control.
Step 3: Look for a Gap Up
The second candle should open significantly above the first candle’s opening price.
Step 4: Confirm Strong Bullish Momentum
The bullish candle should have a relatively large body and close strongly.
Step 5: Wait for Additional Confirmation
Many traders wait for continued upward movement before entering a trade.
Example of a Bullish Kicker Pattern
Imagine a stock has been declining for several weeks.
- Day 1 closes with a bearish candle.
- Overnight, positive company news changes market sentiment.
- Day 2 opens sharply higher than the previous session’s opening price.
- Buyers continue pushing prices higher throughout the session.
This creates the Bullish Kicker Pattern and may signal the beginning of a strong upward trend.
Why Is the Bullish Kicker Considered Powerful?
The Bullish Kicker stands out because it represents a sudden shift in control.
Unlike other reversal patterns that develop gradually, the Bullish Kicker demonstrates that buyers immediately overpower sellers.
This dramatic change often leads to strong follow-through moves and increased market participation.
The pattern also reflects confidence among institutional investors, who may drive significant price movements.
Advantages of the Bullish Kicker Pattern
Strong Reversal Signal
It is considered one of the strongest bullish reversal patterns in technical analysis.
Easy to Recognize
The gap and powerful bullish candle make the pattern relatively simple to identify.
Works Across Different Markets
The pattern can be applied to:
- Stocks
- Forex
- Commodities
- Cryptocurrencies
- Indices
Suitable for Various Time Frames
Traders can use it on:
- Intraday charts
- Daily charts
- Weekly charts
- Swing trading setups
Limitations of the Bullish Kicker Pattern
Despite its strength, the pattern has limitations.
Rare Occurrence
The Bullish Kicker does not appear frequently.
Gap Requirement
True Bullish Kicker patterns require a clear gap, which may not occur often in some markets.
False Signals
No candlestick pattern guarantees success.
Market Conditions Matter
The broader market trend can influence the reliability of the signal.
Best Indicators to Use with the Bullish Kicker Pattern
Combining the pattern with other tools can improve trading accuracy.
Relative Strength Index (RSI)
An oversold RSI reading can strengthen the bullish reversal signal.
Support Levels
Patterns forming near major support zones may offer higher probability setups.
Volume Analysis
Strong volume during the bullish candle confirms buyer participation.
Moving Averages
A move above key moving averages can provide additional confirmation.
Trading Strategy Using the Bullish Kicker Pattern
Entry Point
Many traders enter after the bullish candle closes or after additional confirmation.
Stop Loss Placement
Place the stop loss below the low of the bullish candle or below a nearby support level.
Profit Targets
Potential targets include:
- Previous resistance zones
- Fixed risk-reward ratios such as 1:2 or 1:3
- Trend-following exits
Risk Management
Always use proper position sizing and avoid risking too much capital on a single trade.
Common Mistakes Traders Make
Ignoring Confirmation
Even strong patterns benefit from additional confirmation.
Overlooking Market Context
The overall market environment should always be considered.
Trading Without a Stop Loss
Protecting capital is essential for long-term success.
Ignoring Volume
Volume often validates the strength of the reversal.
Tips for Beginners
- Practice identifying Bullish Kicker patterns on historical charts.
- Combine the pattern with support and resistance analysis.
- Use RSI and volume for confirmation.
- Follow a disciplined trading plan.
- Maintain proper risk management.
- Avoid emotional decision-making.
Bullish Kicker vs Bullish Engulfing Pattern
Although both patterns signal bullish reversals, they differ significantly.
Bullish Kicker Pattern
- Features a clear gap between candles.
- Indicates an abrupt shift in sentiment.
- Considered one of the strongest reversal signals.
Bullish Engulfing Pattern
- The second candle engulfs the first candle’s body.
- Does not require a gap.
- Reflects a more gradual change in momentum.
Understanding these differences can help traders choose the appropriate setup.
Conclusion
The Bullish Kicker Candle Pattern is one of the most powerful bullish reversal patterns used in technical analysis. Its distinctive gap and strong bullish candle highlight a dramatic shift from bearish sentiment to bullish control.
Although the pattern offers high-quality trading opportunities, it should not be used in isolation. Combining it with support levels, RSI, volume analysis, moving averages, and sound risk management can improve decision-making and increase the probability of success.
By learning how to identify and trade the Bullish Kicker correctly, traders can gain greater confidence and improve their ability to recognize potential trend reversals in the financial markets.