
Introduction
The Tweezer Bottom candle pattern is a popular bullish reversal pattern used in technical analysis. Traders use this pattern to identify potential buying opportunities after a downtrend. It is considered one of the simplest candlestick patterns to recognize and can be highly effective when combined with other technical indicators and proper risk management.
Whether you trade stocks, forex, commodities, or cryptocurrencies, understanding the Tweezer Bottom pattern can help you recognize moments when sellers are losing strength and buyers are beginning to take control of the market.
In this guide, we will explore what the Tweezer Bottom candle pattern is, how it forms, why it matters, and how traders use it to improve their trading decisions.
What is a Tweezer Bottom Candle Pattern?
A Tweezer Bottom is a bullish reversal candlestick pattern that usually appears at the end of a downtrend. The pattern consists of two consecutive candles with nearly identical lows.
The key characteristic of the pattern is that both candles touch or reach the same support level, showing that sellers attempted to push the price lower but failed.
The pattern indicates that buyers are stepping in to defend a price level, increasing the possibility of an upward reversal.
Structure of a Tweezer Bottom Pattern
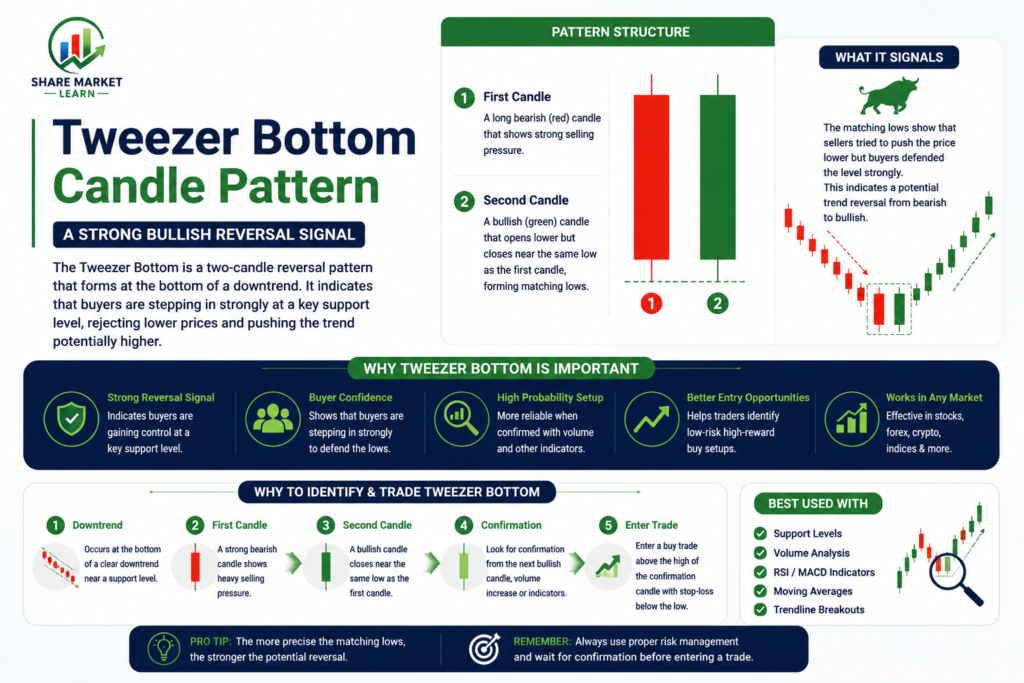
The Tweezer Bottom pattern typically consists of two candles:
First Candle
- Usually a bearish (red) candle
- Continues the existing downtrend
- Shows sellers remain in control
Second Candle
- Can be bullish or bearish, but bullish is stronger
- Forms a low near the first candle’s low
- Indicates sellers failed to push the price lower
When both candles create almost identical lows, the market signals strong support at that level.
How Does the Tweezer Bottom Pattern Form?
Understanding the psychology behind the pattern helps traders interpret its significance.
Step 1: Existing Downtrend
The market has been moving lower for several sessions, and sellers dominate price action.
Step 2: First Candle Creates a New Low
The first candle continues the bearish momentum and reaches a low point.
Step 3: Sellers Attempt Another Breakdown
During the next trading session, sellers try to push prices below the previous low.
Step 4: Buyers Defend the Support Level
Buyers enter the market and prevent prices from falling further.
Step 5: Equal Lows Are Formed
The second candle forms a low very close to the first candle’s low, creating the Tweezer Bottom structure.
This indicates that support is holding and selling pressure is weakening.
Why is the Tweezer Bottom Pattern Important?
The Tweezer Bottom pattern is important because it can provide an early warning of a trend reversal.
Traders pay attention to this pattern because:
- It is easy to identify
- It highlights strong support levels
- It signals weakening bearish momentum
- It helps traders find potential buying opportunities
- It can improve entry timing when combined with confirmation signals
The pattern becomes even more powerful when it appears near major support zones.
How to Identify a Valid Tweezer Bottom Pattern
To identify a high-quality Tweezer Bottom pattern, look for the following characteristics:
1. Prior Downtrend
The market should be in a noticeable downtrend before the pattern appears.
2. Two Similar Lows
Both candles should have nearly identical low points.
3. Strong Support Zone
The pattern often forms near an important support level.
4. Bullish Confirmation
A bullish candle after the pattern increases reliability.
5. Increased Trading Volume
Higher volume can indicate stronger buyer participation.
Trading Strategy Using the Tweezer Bottom Pattern
Many traders use the Tweezer Bottom pattern as part of a complete trading strategy.
Entry Point
A common approach is to enter a buy trade after confirmation.
Confirmation may occur when:
- The next candle closes above the high of the second candle
- Price breaks a nearby resistance level
- Other indicators support a bullish reversal
Stop Loss Placement
Place the stop loss below the lowest point of the Tweezer Bottom pattern.
This helps limit losses if the market continues downward.
Profit Target
Potential targets include:
- Previous resistance levels
- Swing highs
- Risk-to-reward ratios such as 1:2 or 1:3
- Key Fibonacci levels
Using Technical Indicators with the Tweezer Bottom Pattern
Combining the pattern with indicators can improve trade accuracy.
Relative Strength Index (RSI)
If RSI shows oversold conditions when a Tweezer Bottom forms, the probability of a reversal may increase.
Moving Averages
A bounce from a major moving average can strengthen the bullish signal.
MACD Indicator
A bullish MACD crossover alongside a Tweezer Bottom pattern can provide additional confirmation.
Volume Analysis
Increasing volume during the formation of the pattern often indicates stronger buying pressure.
Advantages of the Tweezer Bottom Pattern
Easy to Understand
Even beginners can quickly learn how to identify it.
Clear Support Level
The matching lows clearly indicate a support zone.
Useful Across Markets
The pattern works in stocks, forex, commodities, and cryptocurrencies.
Early Reversal Signal
It can provide an early indication that a downtrend is ending.
Flexible Trading Tool
It can be combined with multiple technical analysis methods.
Limitations of the Tweezer Bottom Pattern
Like all trading patterns, the Tweezer Bottom has limitations.
False Signals
Not every pattern leads to a successful reversal.
Requires Confirmation
Trading without confirmation can increase risk.
Market Conditions Matter
The pattern performs better in trending markets than in highly volatile sideways markets.
No Guaranteed Success
Even strong-looking setups can fail due to unexpected market events.
Common Mistakes Traders Make
Ignoring the Existing Trend
The pattern is most reliable after a downtrend.
Entering Too Early
Waiting for confirmation can reduce false signals.
Ignoring Volume
Low volume may weaken the significance of the pattern.
Poor Risk Management
Trading without a stop loss can lead to unnecessary losses.
Depending on One Pattern Alone
Successful traders combine candlestick patterns with broader market analysis.
Practical Example of a Tweezer Bottom
Imagine a stock has been declining for several days.
On the first day, a bearish candle forms and reaches a low of ₹500.
The following day, sellers attempt to push the price below ₹500 but fail. Buyers enter the market, and the second candle also forms a low near ₹500.
This creates a Tweezer Bottom pattern.
The repeated rejection of the ₹500 level suggests strong support. If the next candle moves higher, traders may view it as confirmation of a potential bullish reversal.
Best Timeframes for the Tweezer Bottom Pattern
The pattern can be used across various trading styles.
Intraday Trading
- 5-minute charts
- 15-minute charts
Swing Trading
- 1-hour charts
- 4-hour charts
Positional Trading
- Daily charts
- Weekly charts
Generally, patterns on higher timeframes tend to provide stronger and more reliable signals.
Conclusion
The Tweezer Bottom candle pattern is a valuable bullish reversal signal that helps traders identify potential trend changes after a downtrend. Its simple structure, clear support level, and ease of recognition make it popular among both beginner and experienced traders.
While the pattern can provide useful trading opportunities, it should not be used in isolation. Combining the Tweezer Bottom pattern with volume analysis, RSI, MACD, moving averages, and proper risk management can significantly improve trading decisions.
By understanding the psychology behind the pattern and waiting for confirmation before entering trades, traders can use the Tweezer Bottom pattern more effectively and increase their chances of success in the financial markets.